Alternative Comparison
Alternative Comparison
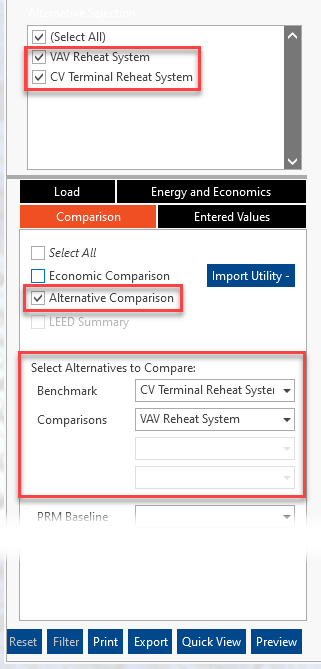
The alternative comparison report allows the user to compare the energy consumption and peak demand of up to four alternatives in a side-by-side manner. One alternative must be set as the “benchmark” by which all other alternatives will be compared. In the example below, two alternatives will be compared. Both were calculated for Load and Energy. The alternative named Constant Volume (CV) Terminal Reheat System is the benchmark. The alternative named Variable Air Volume (VAV) Reheat System will be compared to the benchmark.
Energy End Use Comparison
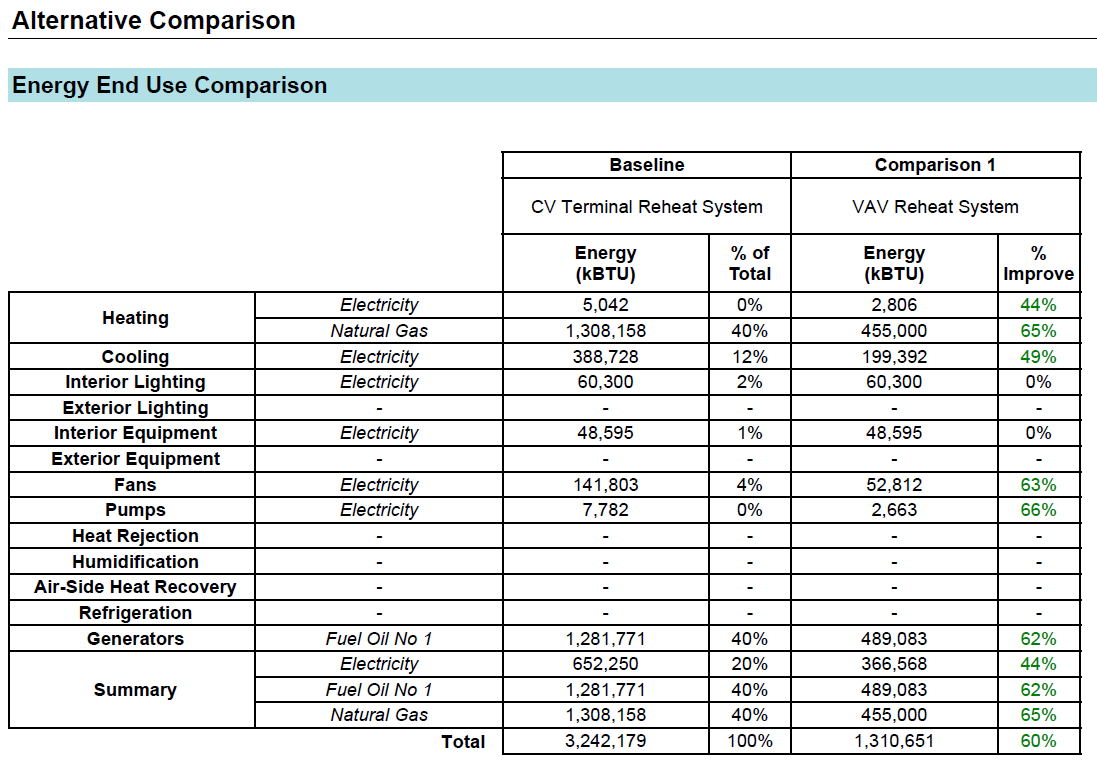
This table provides a breakdown of energy consumption by use type and fuel type. In the example below, the alternative named “CV Terminal Reheat System” consumed 1,308,158,000 btus of natural gas for heating and 388,728,000 btus of electricity for cooling.
The natural gas consumed for heating comprised 40 percent of the total energy consumption. The alternative named “VAV Reheat System”, however, consumed 455,000,000 btus of natural gas for heating and 199,392,000 btus of electricity for cooling.
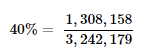
The % of Total column indicates how much of the total energy in the benchmark was contributed by the specified row. The percent of total for heating natural gas in CV Terminal Reheat System was calculated according to the following equation:
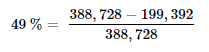
The % Improvement column indicates the change for that specific flow from the Benchmark alternative. The example below, CV Terminal Reheat Systems consumed 388,782,000 btus of electricity for cooling, while VAV Reheat Systems consumed 455,000,000 btus of electricity for cooling, an improvement of 65 percent.
The percent improvement for cooling electricity was calculated according to the following equation:
|
Heating:
|
|
All heating equipment including consumers associated with their equipment libraries. For example, electric heating coils, electric boilers, boiler parasitic loads. This does not include fans or pumps defined separately in the loop.
|
|
Cooling:
|
|
All cooling equipment including consumers associated with their equipment libraries. For example, DX cooling coil and its crankcase heater, air cooled piece of equipment and its condenser fan, water cooled chiller, cooling mode of operation for a heat pump. This does not include fans or pumps defined separately in the loop.
|
|
Interior Lighting:
|
|
Interior lighting defined in the internal load properties on the Create Building tab
|
|
Exterior Lighting:
|
|
Exterior lighting defined in the Create Site tab
|
|
Interior Equipment:
|
|
Miscellaneous equipment defined in the internal load properties on the Create Building tab
|
|
Exterior Equipment:
|
|
Exterior Fuel Equipment from the Power-Using Objects toolbar on the Create Site tab
|
|
Fans:
|
|
All fans (supply, return, OA, exhaust) but does not include condenser fans
|
|
Pumps:
|
|
All pumps in loops defined in Create Plants
|
|
Heat Rejection:
|
|
This includes both the condenser fan and the basin heater for condenser loops defined in Create Plants
|
|
Humidification:
|
|
Humidifier defined in Create Systems
|
|
Heat Recovery:
|
|
Energy consumption associated with airside energy recovery devices. This is not the amount of energy recovered. This also does not include waterside heat recovery.
|
|
Water Systems:
|
|
Exterior Water Equipment from the Power-Using Objects toolbar on the Create Site tab
|
|
Refrigeration:
|
|
Not yet supported
|
|
Generators:
|
|
This is the fuel used by Internal Combustion Engine and Combustion Turbine from the Power-Generating Objects toolbar on the Create Site tab. Note, this is only the fuel consumed to generate the electricity, not the generated electricity because this table only accounts for energy consumed
|
|
Summary:
|
|
This shows the totals in each utility category
|
|
District Cooling:
|
|
District cooling consumption for each category
|
|
Electricity:
|
|
Electricity consumption for each category
|
|
Additional Fuel:
|
|
This is a sum of the consumption of all other utilities (Coal, Diesel, Fuel Oil #1, Fuel Oil #2, Gasoline, Other Fuel 1, Other Fuel 2)
|
|
District Heating:
|
|
District heating consumption for each category
|
|
Natural Gas:
|
|
Natural Gas consumption for each category
|
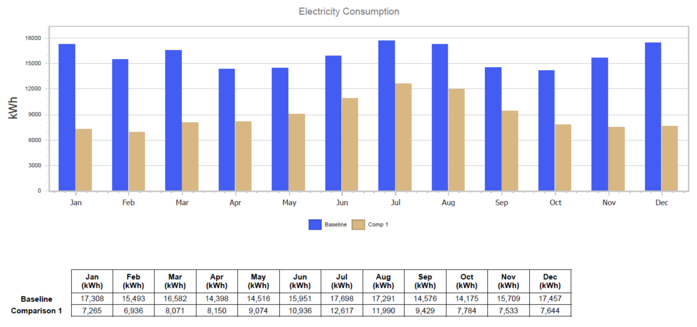
Monthly Utility Use Consumption
For each fuel type, a graph of monthly consumption and demand is generated. The example figures below compare the electrical consumption and demand of two alternatives. In the example below, the baseline consumed 17,698 kWh of electricity in July, while Comparison 1 consumed 12,617 kWh of electricity in July. See the Site Consumption Summary report.
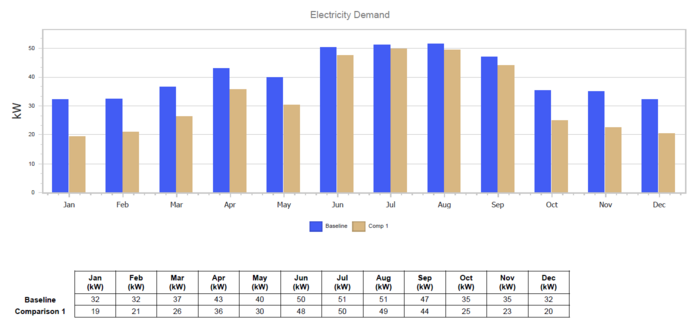
In the example below, the baseline experienced a peak electrical demand of 51 kW in July, while Comparison 1 experienced a peak electrical demand of 50 kW in July. See the Utility Peak Demand Summary report.
Energy Intensity Comparison
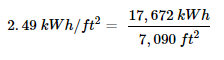
The following figures depict the energy use intensity per floor area of the building. In the example below, the alternative named “CV Terminal Reheat System” consumed 2.49 kWh of electrical lighting energy per square foot of floor area. In the Energy End Use Comparison table above, the alternative consumed 60,300,000 btus of electrical lighting energy. Using the conversion of 3412.14 btus/kWh, the btu value converts to 17,672 kWh of electrical lighting energy.
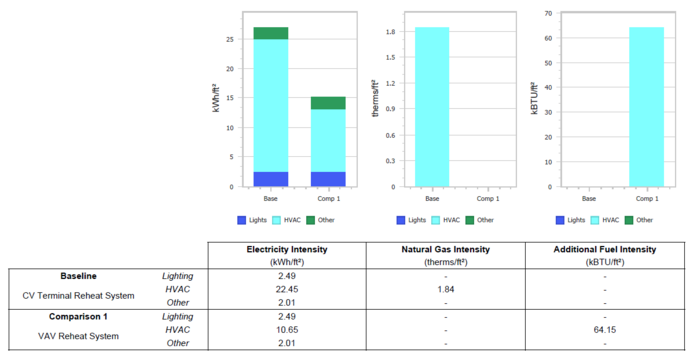
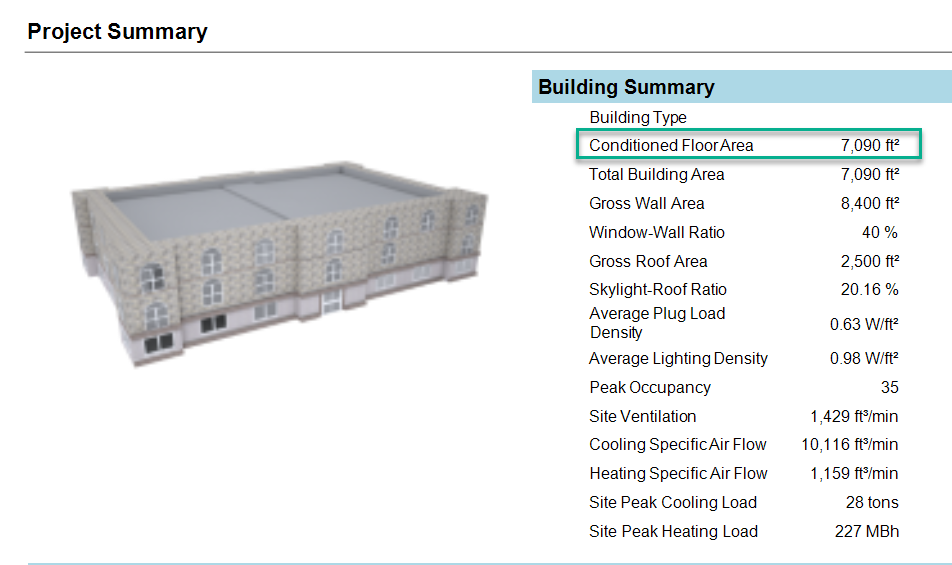
The energy intensity rates were calculated with respect to the Conditioned Building Area on the Project Summary report. For example,
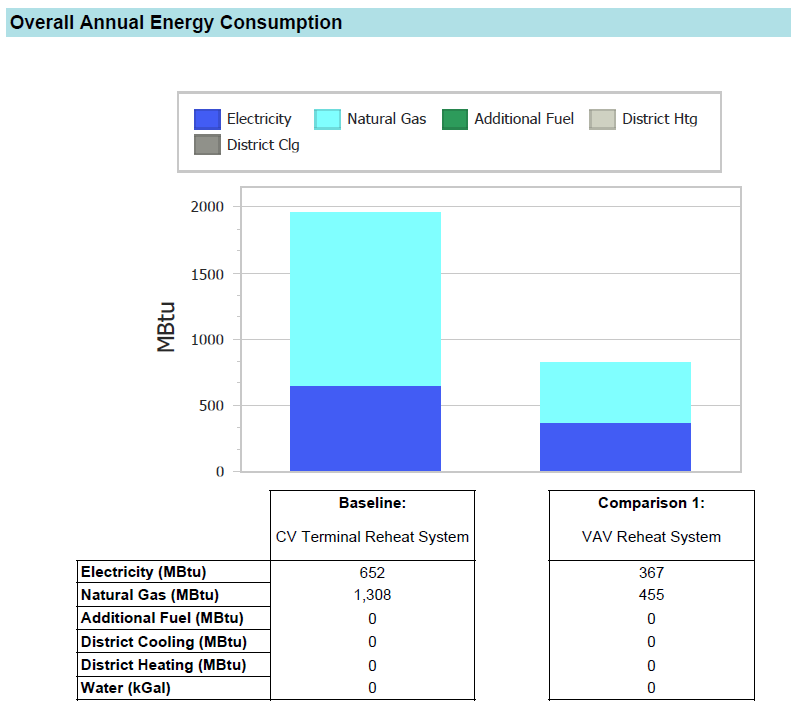
Overall Annual Energy Consumption
This table summarizes the annual energy consumption of the alternatives. The graph at the top is a stacked column chart, with each color representing a different fuel source. The table below the graph shows the values. In the example below, the alternative named “CV Terminal Reheat System” consumed 1,308,000,000 btus of natural gas.