Carbon Footprint and Renewable Energy Summary
Carbon Footprint and Renewables Summary
The Carbon Footprint and Renewables Summary provides you with a look at the carbon footprint of the project as well as a view into the on-site power generation that is modeled. The Carbon Footprint and Greenhouse Gas sections present emissions data for the building and project site. The On-Site and Renewable Energy Contribution Summary section provides a comparison of the annual amount of energy generated versus the amount of energy required by the site that is being satisfied by the utility. The On-Site and Renewable Energy Systems section provides you with a view of how the electrical loads are satisfied in terms of how much the on-site generation is satisfying the demands versus the utility company. This section also displays data regarding thermal sources and how much heat is used to satisfy loads via these components. The On-Site and Renewable Systems Monthly Generation section provides you with the monthly on-site generation through the different means of on-site generation.
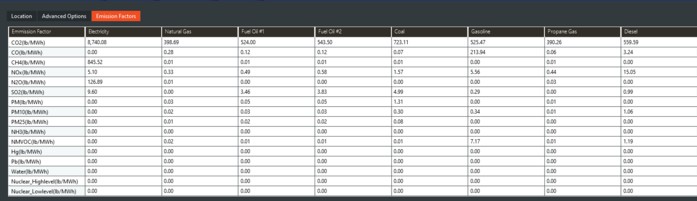
See the weather library for the emissions factors, which determines the amount of contaminant generated per fuel source.
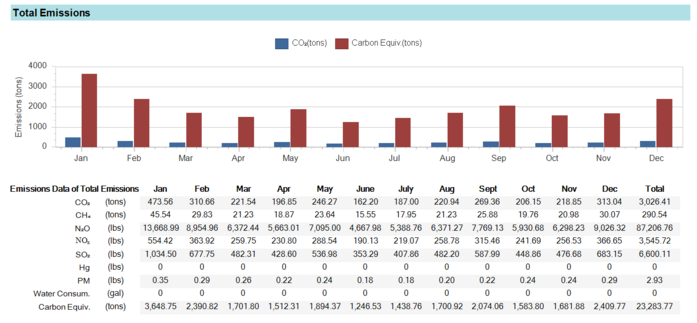
Total Emissions
The total emissions sections provides the monthly estimate of emissions, at least for the contaminants listed. The total is the sum of site and source emissions, discussed next.
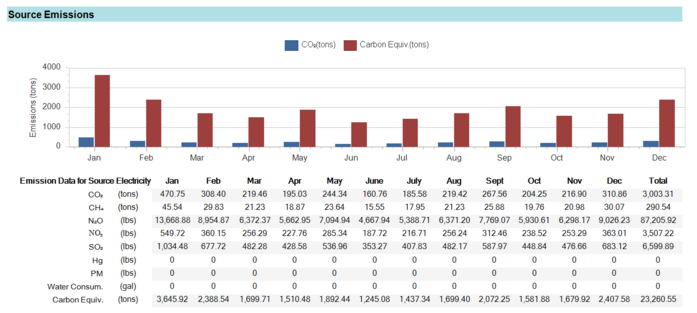
Source Emissions
The source emissions sections provides the monthly estimate of emissions, at least for the contaminants listed. Source emissions are generated by the power plants and utilities, not the building itself.
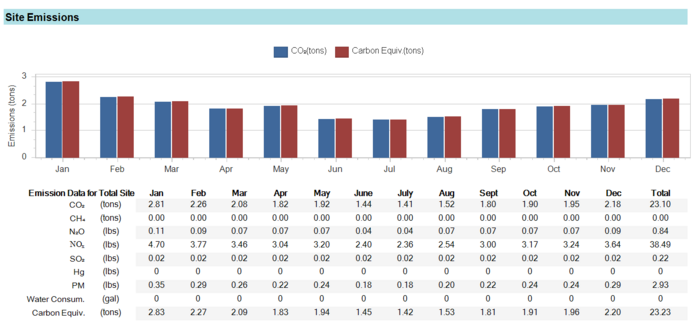
Site Emissions
The site emissions sections provides the monthly estimate of emissions, at least for the contaminants listed. Site emissions are generated by the building itself, not the power plants and utilities.
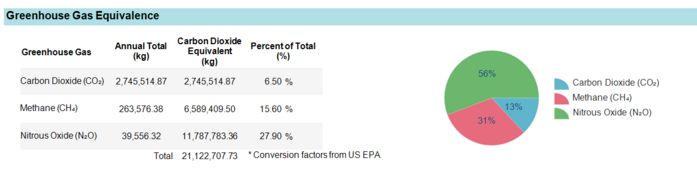
Greenhouse Gas Equivalence
The greenhouse gas emissions table lists the amount of carbon dioxide, methane, and nitrous oxide generated, in kilogram per year.
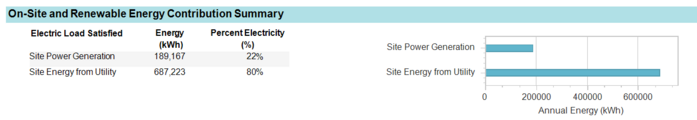
On-Site and Renewable Energy Contribution Summary
This table shows a concise summary of how much energy was generated on site versus purchased from a utility. The example below shows a total of 22 + 80 = 102 percent. During the year, there was an excess of energy sold back to the utility, explained in the next section. Site Power Generation is the same as Total On-Site Electric Sources in the next section. Site Energy from Utility is the same as Electricity Coming From Utility in the next section.
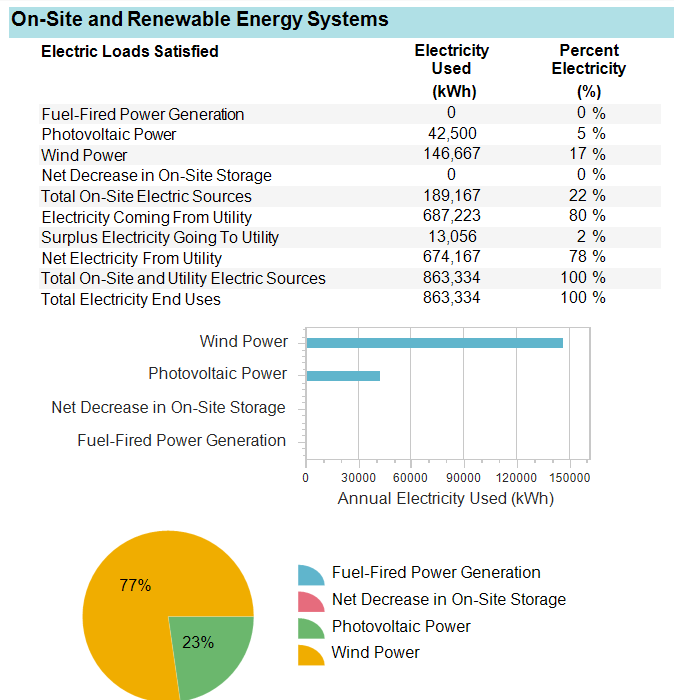
On-Site and Renewable Energy Systems
This table lists all energy sources. In the table below, the solar panels (photovoltaic power) produced 42,500 kWh, equal to 5 percent of the energy required by the building. The total on-site power generation was 189,167 kWh, equal to the 22 percent shown in the previous section. During the year, 13,056 kWh was sold back to the utility. This accounts for why the Total On-Site Electric Sources sums to 102 percent: 2 percent was sold back. 102 – 2 = 100 percent.
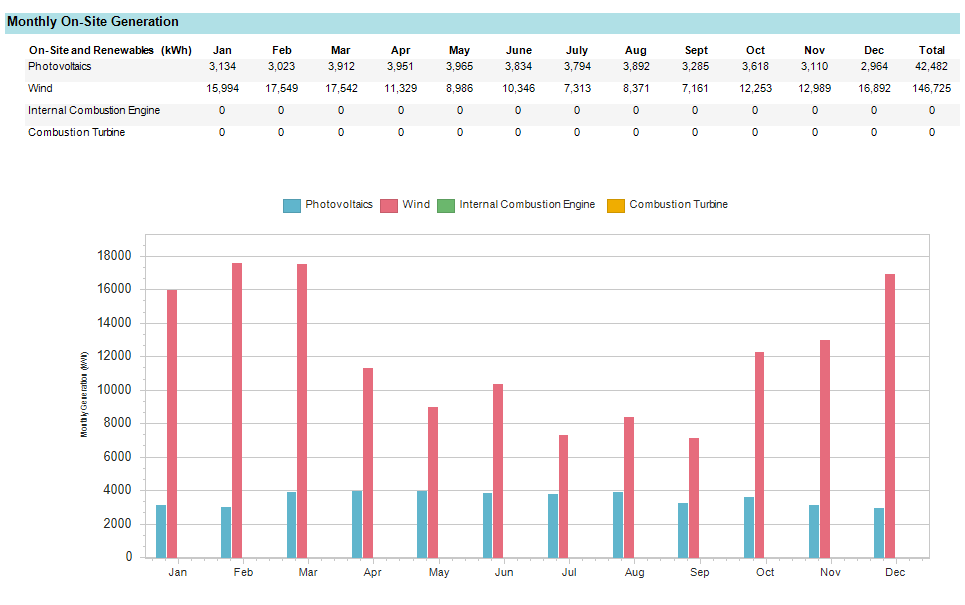
Monthly On-Site Generation
This table lists the monthly energy generation of the four types of generators. See Building & Site -> Create Site. In the example below, solar panels (photovoltaics) produced 42,482 kWh and the wind turbine produced 146,725 kWh.