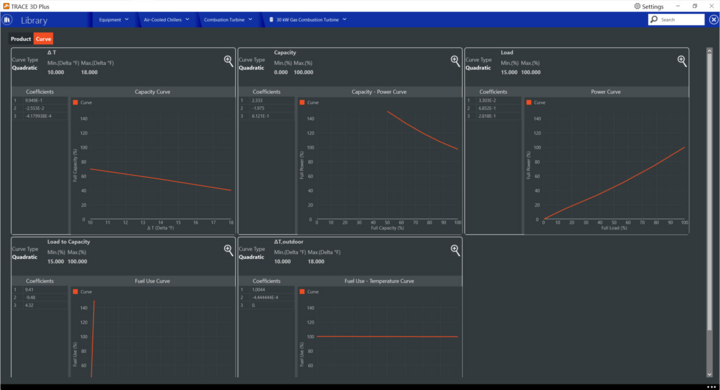
Curve Tab
The description of the performance curves for the Combustion Turbine Air cooled chillers is listed below.

Capacity Curve
This quadratic curve determines the ratio of available capacity to nominal capacity.
The equation for the Capacity Curve is:
Where:
y = Chiller’s available capacity to nominal capacity ratio (%)
C1 to C3 = coefficients

TempCondIn = Temperature entering the condenser (water or air temperature depending on condenser type)
TempCondInDesign = Temp Design Condenser Inlet from User input above
TempEvapOut = Temperature leaving the evaporator
TempEvapOutDesign = Temp Design Evaporator Outlet from User input above
TempRiseCoefficient = User Input from above
The curve has the following fields:
X Axis: 
Y Axis: Full Capacity (%)
Curve Type: The curve is quadratic
Capacity –Power Curve (Power ratio curve)
This quadratic curve shows the percentage of full power capacity as a function of the chiller’s capacity. The equation for the Capacity-Power Curve is:
Where:
y = percentage of full power (%)
C1 to C3 = coefficients
X = percentage of full load capacity (%)
The curve has the following fields:
X Axis: Full capacity (%)
Y Axis: Full Power (%)
Curve Type: The curve is quadratic
Capacity Min / Max: Minimum and Maximum percentage of the capacity
Power Curve (Full Load Ratio)
This quadratic curve shows the fraction of full load power capacity as a function of the chiller’s Part load ratio. The equation for the Capacity-Power Curve is:

Where:
y = fraction of full power (%)
C1 to C3 = coefficients
X = part load ratio (%)
The curve has the following fields:
X Axis: Full load (%)
Y Axis: Full Power (%)
Curve Type: The curve is quadratic
Capacity Min / Max: Minimum and Maximum percentage of the load
Fuel used Curve (Fuel Input curve)
This quadratic curve determines the Ratio of Fuel Input to Energy Output. The equation for the Fuel used Curve is:

Where:
y = Ratio of Fuel Input to Energy Output (%)
C1 to C3 = coefficients
X = Ratio of Load to Combustion Turbine Engine Capacity (%)
The curve has the following fields:
X Axis: Full load to Capacity (%)
Y Axis: Fuel Use (%)
Curve Type: The curve is quadratic
Load to Capacity Min / Max: Minimum and Maximum percentage of the load to capacity
Fuel used - Temperature Curve
This quadratic curve determines the Ratio of Fuel Input to the Temperature Difference between the current and design ambient temperatures. The equation for the Fuel used Curve is:
Where:
y = Ratio of Fuel Input to  (%)
(%)
C1 to C3 = coefficients
X =  (Current Ambient Temperature – Design Ambient Temperature) (°F)
The curve has the following fields:
X Axis:  (°F)
(°F)
Y Axis: Fuel Use (%)
Curve Type: The curve is quadratic