Lighting and Daylighting Summary
Lighting and Daylighting Summary
The Lighting and Daylighting Summary provides a concise, detailed look at the lighting (both natural and artificial) available in the project.
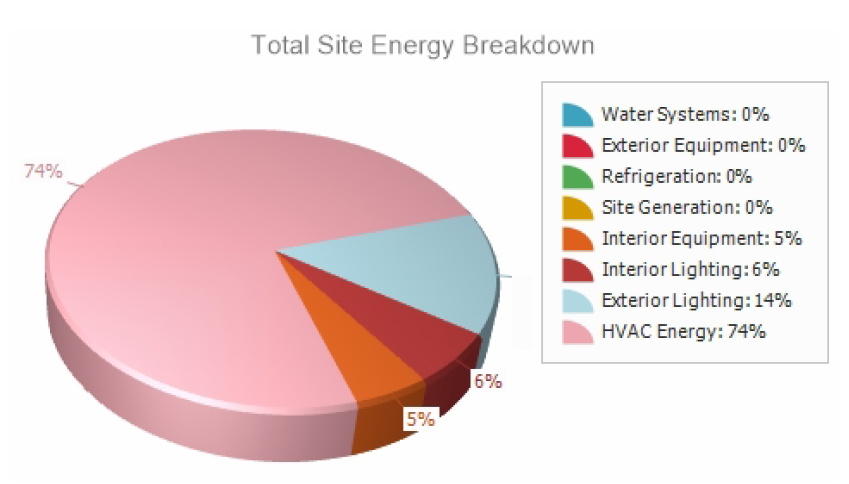
Total Site Breakdown
The total site breakdown provides another depiction of energy distribution on the site. In the example below, 74 % is HVAC, 14 % is exterior lighting, 6 % is interior lighting, and 5 % is interior equipment.
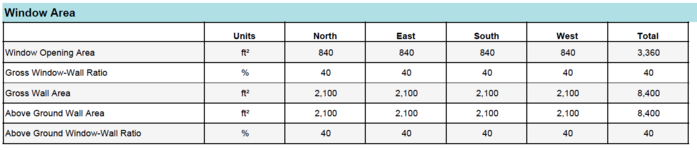
Window Area
The window area table provides the window areas per cadinal direction.
Wall classification:
-
North: 315° to 44.9°
-
East: 45° to 134.9°
-
South: 135° to 224.9°
-
West: 225° to 314.9°
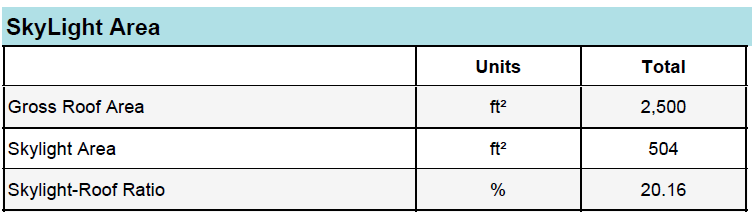
Skylight Area
The skylight area table show the quantity of roof and skylight area on the building.
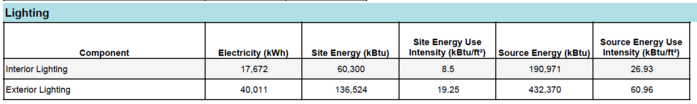
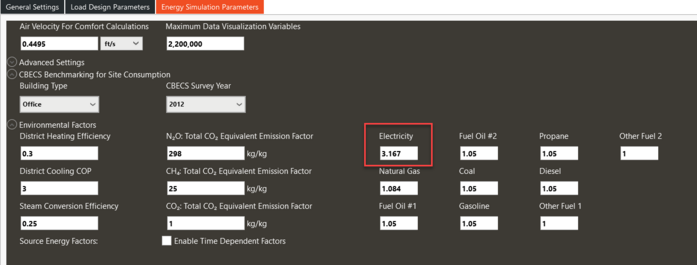
The lighting table shows the amount of interior versus exterior lighting on the site. Both site and source energy are shown. In the example below, the source energy applies the electricity factor of 3.167 from the simulation settings. Multiply the site energy by the environmental factor to produce the source energy. For example, 60,300,000 btu site energy x 3.167 = 190,971,000 btu source energy.
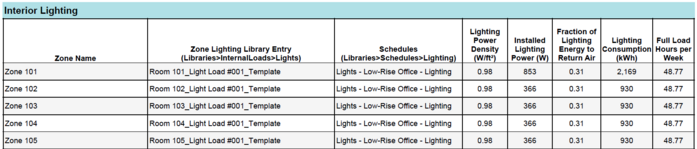
Interior Lighting
The interior lighting table show the input lighting loads. See Building & Site -> Create Building -> Construction -> Properties -> Internal Loads. Also see Templates -> Room Types -> Internal Loads -> Properties. In the example below, Zone 101 has 0.98 watts per square foot, for a total of 853 watts. 31 percent of the heat rises into the plenum away from the zone to the main air handler, while the other 69 percent directly heats the zone. Zone 101 consumed 2,169 kWh for lighting, with an annual average rate of 48.77 full load hours per week. Out of 168 hours per week, the lights were on 48.77 / 168 = 29 percent of the time. The lighting consumption agrees: 2,169 kWh / (0.853 kW x 8760 hours per year) = 29 percent.