Plant Summary
Plant Summary Report
The Plant Summary report displays the sizing information for each plant loop in the project, divided into sections. Each section shows the loop loads, flow rates, temperatures, and served coils. The capacity of water coils is calculated from the water flowrate through the coil the temperature change of the water.
The approximate IP forms of the equation for coil capacity are:
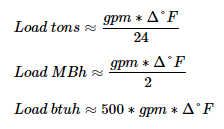
Likewise, the approximate SI form of the equation for coil capacity is:
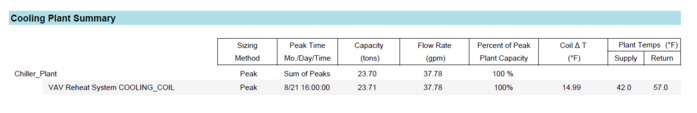
Cooling Plant Summary
The Sizing Method is defined in the properties in the Configure Plants tab of the Plants section as either Peak or Block. The Peak Time is the peak based on the loads for each coil. The Capacity and Flow Rate are calculated based on the loads on each of the coils. The Coil Delta T and Supply and Return Temps are defined in the properties on the Configure Plants tab of the Plants section. The Percent of Peak Plant Capacity is calculated as the coil capacity divided by plant capacity.
The cooling plant summary lists a given plant loop, then lists all coils assigned to the loop. The next column to the right is the Sizing method. Block refers to the method called “Simulation Peak” while peak refers to the method called “Ideal Loads Peak”. See the document titled “Ideal Peak Versus Simulation Peak” in the Getting Started Guide for a detailed discussion of these two approaches and their assumptions. The remaining columns show the capacity, flow rate, percentage of plant capacity, coil temperature difference, supply water temperature, and return water temperature.
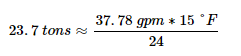
In the example below, there exists on central chilled water loop named “Chiller_Plant”. Indented under “Chiller_Plant” is the main air handler cooling coil “VAV Reheat System COOLING_COIL”. In the example below, there is a 23.7 ton load on the chiller plant. The chiller plant requires 37.78 gpm with a temperature difference of 15 °F (shown as 14.99 due to conversions from SI). The leaving chiller water temperature is 42 °F and the return water temperature is 57 °F. The chiller plant felt its peak load on August 21 at 16:00 (4:00 pm).
The coil capacity can be hand verified using the equations above:
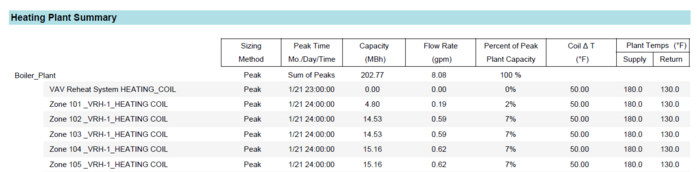
Heating Plant Summary
The heating plant summary lists a given plant loop, then lists all coils assigned to the loop. The next column to the right is the Sizing method. Block refers to the method called “Simulation Peak” while peak refers to the method called “Ideal Loads Peak”. See the document titled “Ideal Peak Versus Simulation Peak” in the Getting Started Guide for a detailed discussion of these two approaches and their assumptions. The remaining columns show the capacity, flow rate, percentage of plant capacity, coil temperature difference, supply water temperature, and return water temperature. .
In the example below, there exists on central hot water loop named “Boiler_Plant”. Indented under “Boiler_Plant” is the main air handler heating coil “VAV Reheat System HEATING_COIL” and all hot water terminal reheat coils, such as “Zone 101 _VRH-1_HEATING_COIL”. The leaving boiler temperature is 180 °F and the return water temperature is 130 °F. The heating plant felt its peak load around midnight in January.
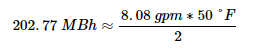
The coil capacity can be hand verified using the equations above:
VRF Plant Summary
Additional sections will appear depending on the project file.