Project Energy and Economic Summary
Project Energy and Economic Summary Report
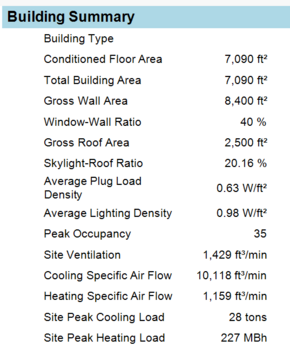
Building Summary
The table provides a high-level view of the building. The following sections defines each line.
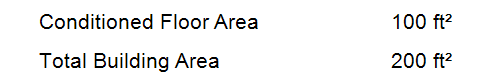
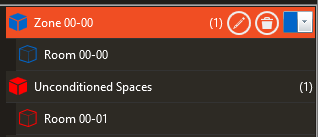
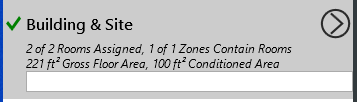
The conditioned floor area and total building area are stated first. Any rooms classified as unconditioned would not be included in the conditioned total. In the example below, two rooms of 100 ft2 occupiable area exist, but only one of the two rooms is conditioned.
See Building & Site -> Create Zones -> Zoning -> Unconditioned Spaces:
See Building & Site -> Create Zones -> Properties:

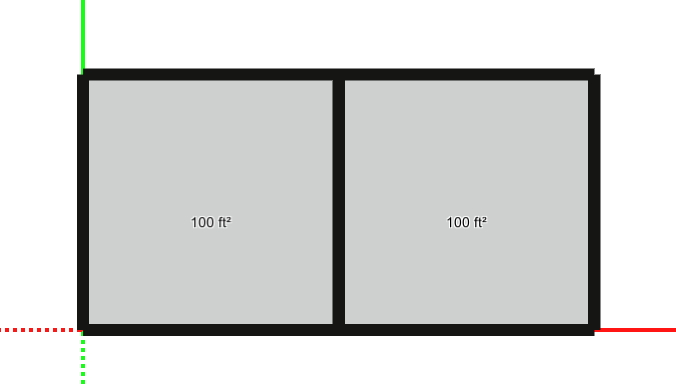
This differs from the value shown on Project Summary -> Summary. In the example below, the outside footprint of the building is 221 ft2, while the internal occupied conditioned area is 100 ft2.
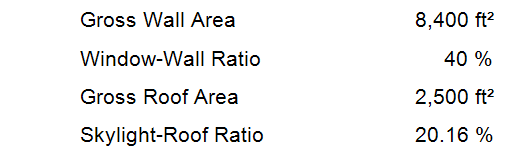
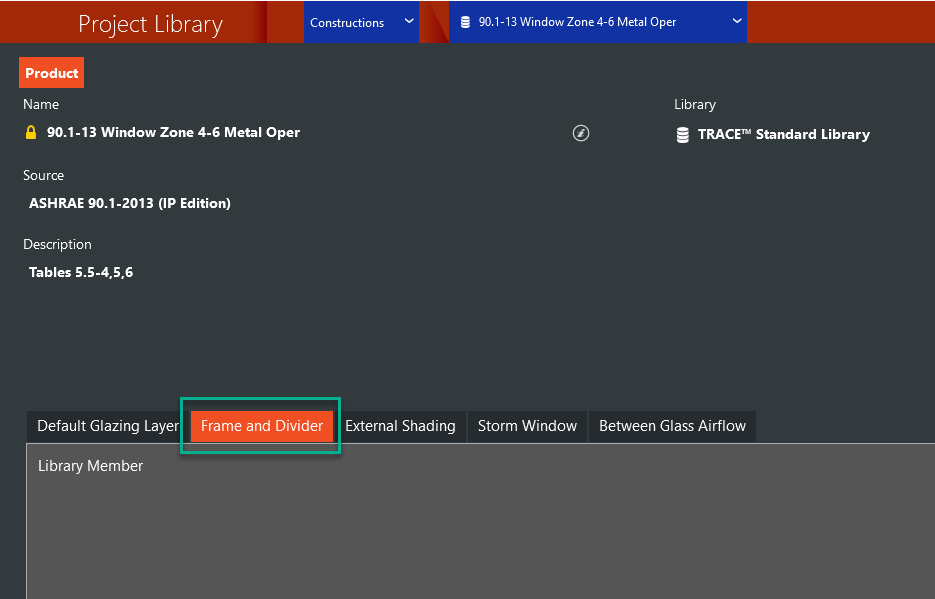
Roof, Wall, Window, and Skylight Areas
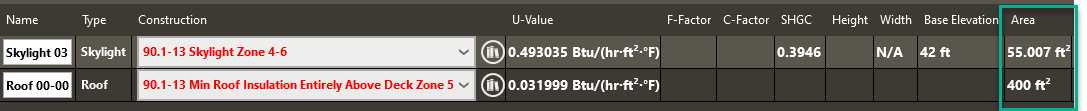
The areas of the building envelope are summarized here. The Window area and skylight area includes the area of any frame and dividers added in the library in addition to the area shown in the properties. In the example below, no frame and divider exists, so the area is based on the value shown in the room properties.
See Building & Site -> Create Building -> Construction -> Room -> Properties -> Construction:

See Library -> Constructions -> Exterior Windows -> Frame and Divider:
Internal Loads
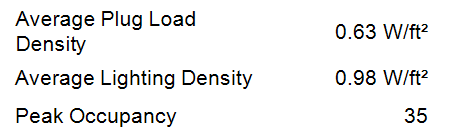
The building average plug load and lighting load on a floor area basis is provided.
Similarly, the peak building occupancy is provided. See Building & Site -> Create Building -> Construction -> Room -> Properties -> Internal Loads.
Airflows
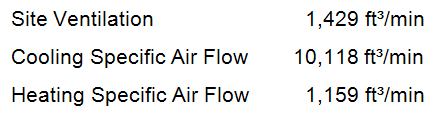
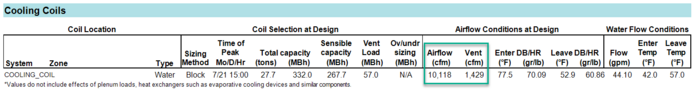
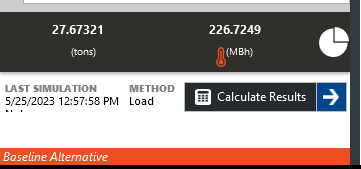
The site ventilation, cooling airflow and heating airflow can be matched to the systems. An easy comparison occurs when only one system exists on the building, and the values can be directly matched. The heating specific airflow of 1,159 cfm would be oversized to at least 1,429 cfm to accommodate ventilation, however. The cooling airflow and ventilation airflow match the system on the System Component Summary, because only one system existed in this example.
Site Peak Loads
The site peak heating and cooling loads match what is shown at the bottom of the alternative on Project Summary (minus rounding). This is the sum of all loads regardless of the impact of systems and zones.

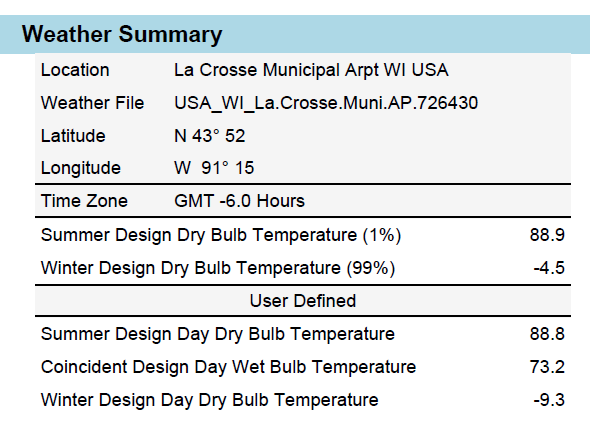
Weather Summary
The weather Location is the name of the weather library referenced in this project. The Weather File indicates where that weather data originated. The rest of the information in this section comes from the Weather Library except the User Defined section. These inputs are defined in the Weather Properties in the project.
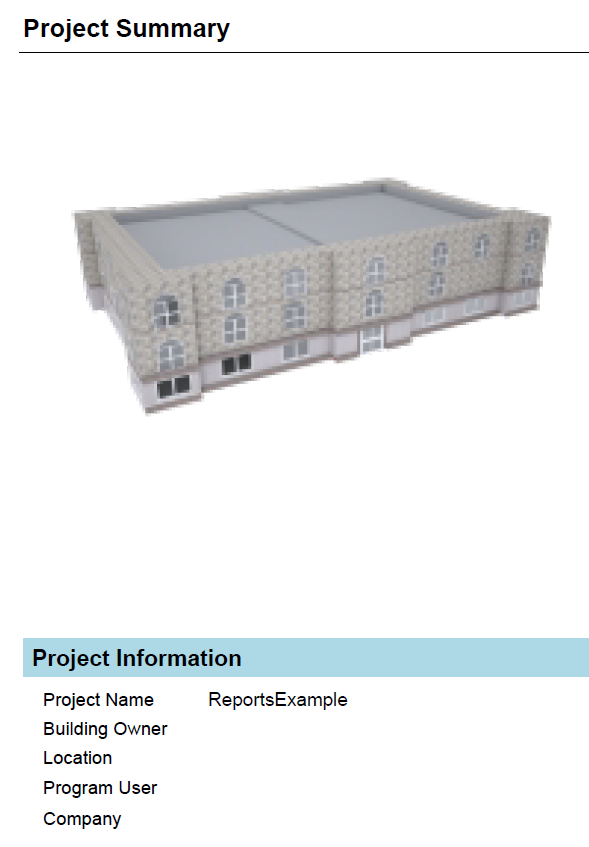
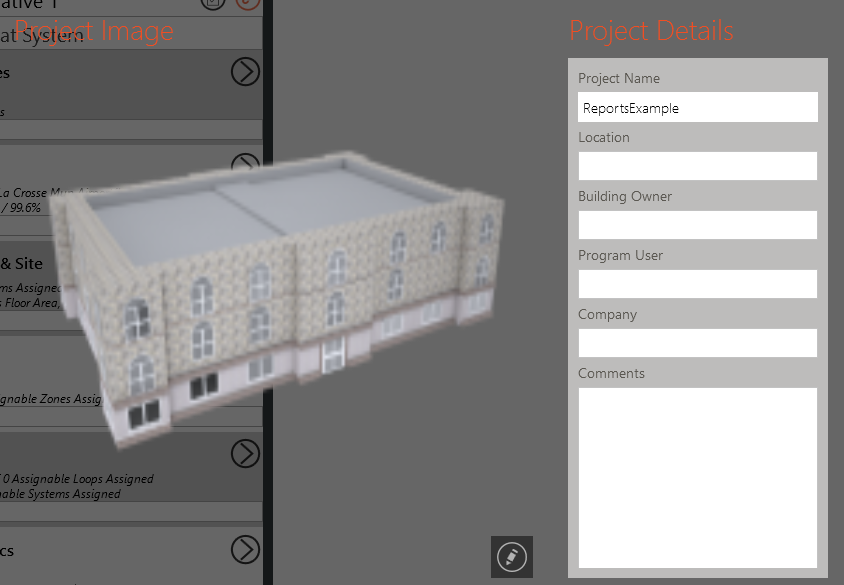
Project Information
This is the same information that is populated on the Link to Title Page report. All the information in this section comes from the Project Details section when the project is initially created. If any of these details were left blank, the fields will not be populated on this report. After the project has been created, all of this information can be edited by going to the App Bar and selecting Project Details.

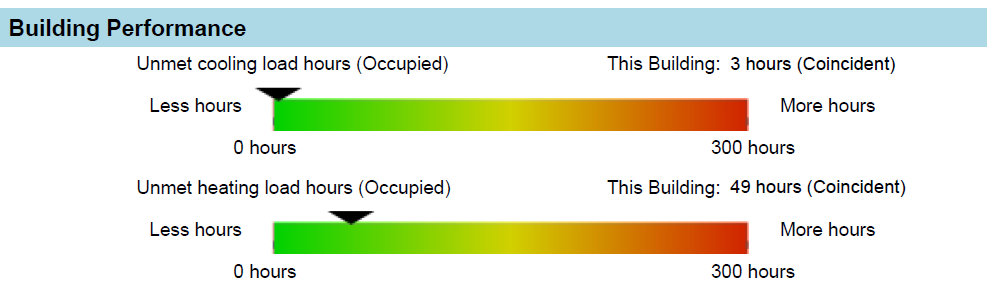
Building Performance
This section shows the number of unmet cooling and heating hours for the building during occupied hours, called coincident unmet hours. See ASHRAE 90.1-2019 Section G3.1.2.3. Coincident unmet hours have the following ramifications. If 1,000 rooms are not met during the same hour of the year, the building accrues only one coincident unmet hour. If 1,000 rooms are not met each at different hours of the year, the building accrues 1,000 coincident unmet hours. The maximum coincident hours in a year is equal to 8760 hours. The slider defaults to a minimum of zero and a maximum of 300. However, if the number of coincident unmet hours is greater than 300, the slider updates so its maximum is the same as the number of unmet hours
An unmet hour is defined as an hour when the space temperature is at least 1 degree higher than the thermostat setpoint in cooling and at least 1 degree lower than the thermostat setpoint in cooling. Only occupied hours are included.
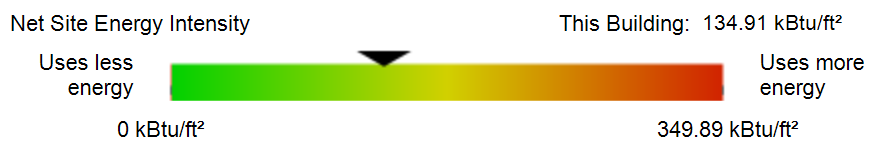
Net Site Energy Intensity is calculated as the total energy consumed by the building (as shown in the Grand Total row of the Alternative Annual Electricity End Use and Demand Comparison section of this report) divided by the total building area. For details, see the Site Consumption Summary report, example below.
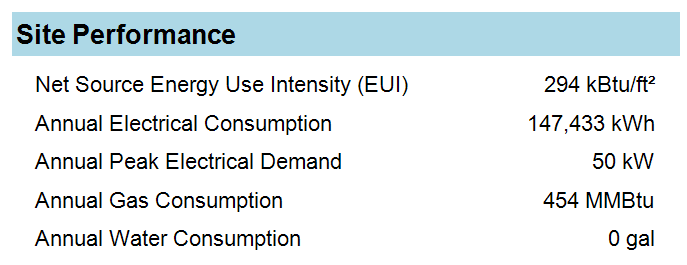
Site Performance
The Net Source Energy Use Intensity is calculated as the source energy divided by the total building area. The Source Energy accounts for all energy and inefficiencies in bringing the utilities to the building. The site electric, gas, and water consumption are also shown. For details, see the Site Consumption Summary report.
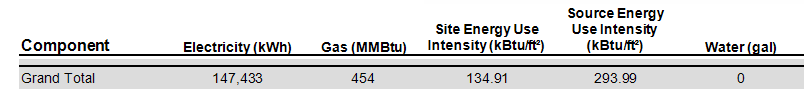
(Data from Site Consumption Summary cut out for clarity)
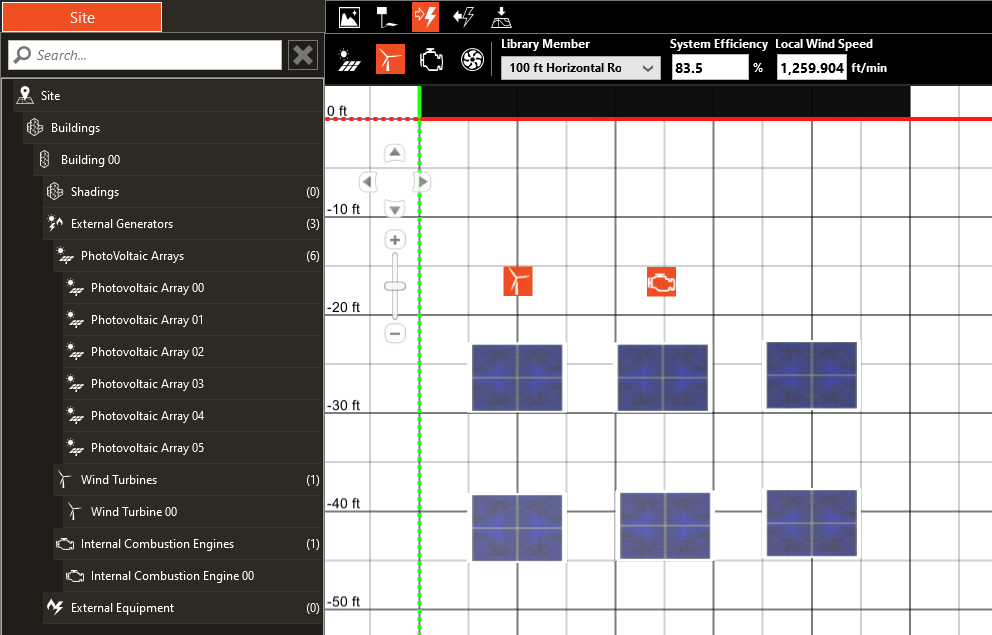
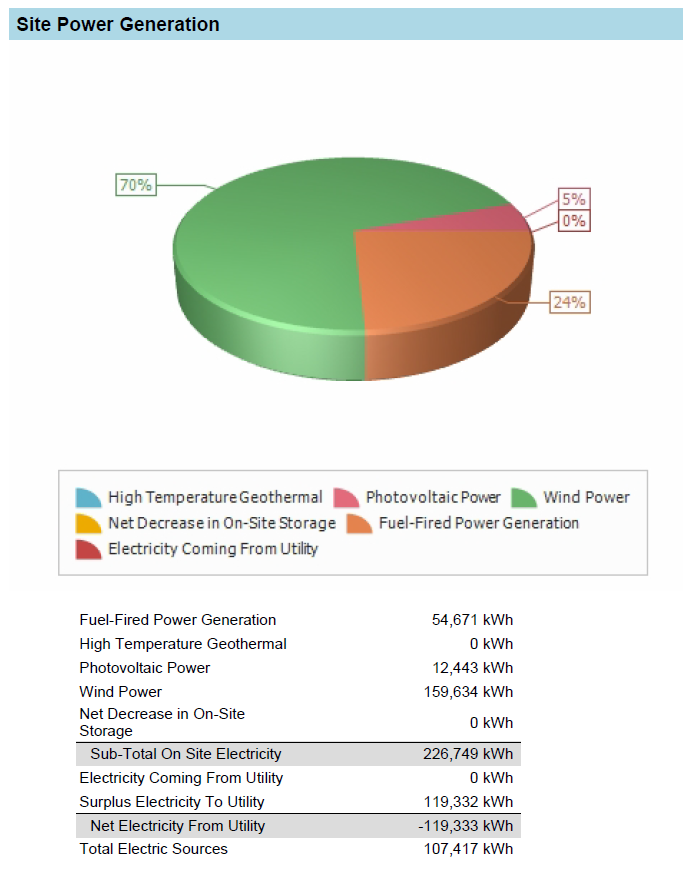
Site Power Generation
This section gives a summary of any site power generators defined on the Create Site tab of the Create Building section. PV panels and wind turbines are on their own lines and internal combustion engines and combustion turbines are combined on the Fuel-Fired Power Generation line. High Temperature Geothermal is not yet supported. The Net Decrease in On-Site Storage accounts for any difference between the starting and ending state of charge if storage has been enabled in the Create Site properties. The Electricity Coming From Utility represents the total electricity required to come from the utility when the on-site generation is not sufficient. The Surplus Electricity to Utility represents electricity that is generated on site but not needed and can be sold back to the utility. This happens during hours when the on-site generation is greater than the electric demand of the site. The Net Electricity from Utility is the Electricity Coming From Utility minus the Surplus Electricity to Utility.
In the example below, solar panels, a diesel generator, and a wind turbine were added to the site on Create Site.
The power generation of each device is displayed in the report. In the example below, the diesel generator produced 54,671 kWh, the solar panels produced 12,443 kWh, and the wind turbine produced 159,634 kWh. The site consumed 107,417 kWh, which left 119,332 kWh available to be sold to the Utility (if selling is an option for the site). The fuel for the diesel generator was purchased. Other reports, such as the Site Consumption Summary and the Economic and Life Cycle Cost Summary, provide additional information.
Site Thermal Energy Recovery
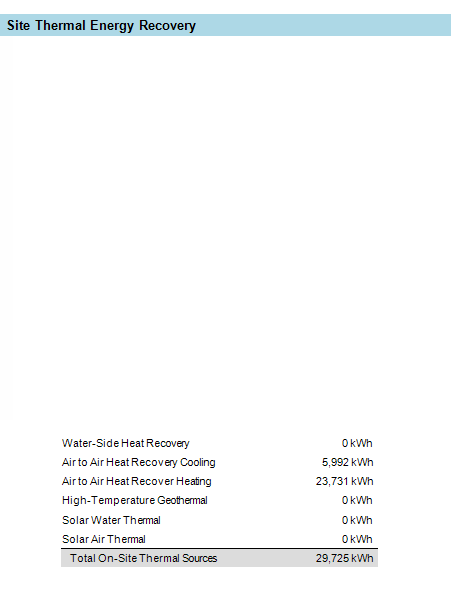
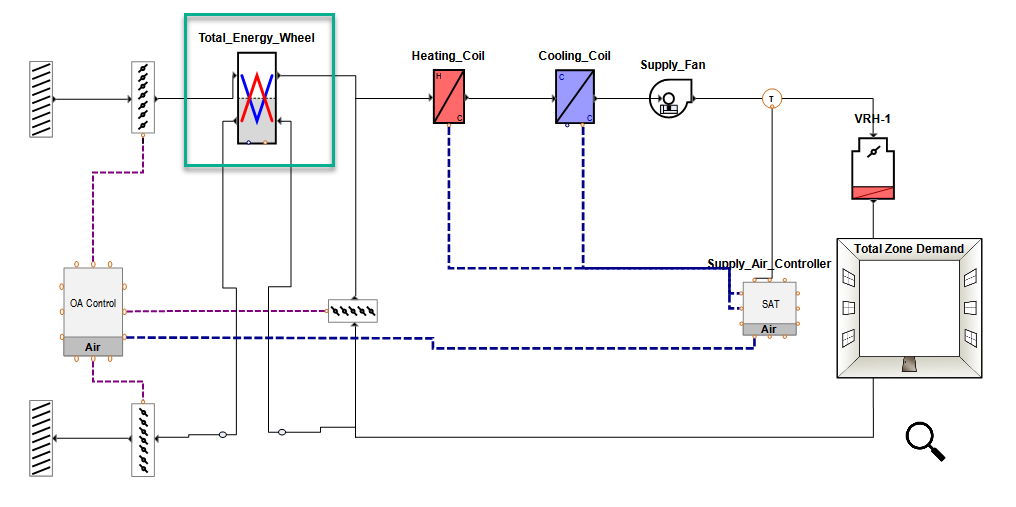
The Air-to-Air Heat Recovered Cooling represents the amount of energy that was recovered by the airside heat recovery device in cooling. The Air-to-Air Heat Recovered in Heating represents the amount of energy that was recovered by the airside heat recovery device in heating. In the example below, a total energy wheel exists on the airside system on the outdoor intake.
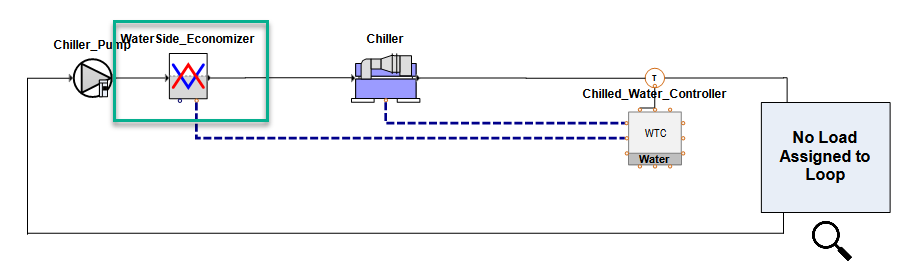
The Water Side Heat Recovery represents the amount of energy that was recovered by the waterside heat recovery device. In the example below, a waterside economizer exists in the cooling plant, connected to a cooling tower.
High-Temperature Geothermal, Solar Water Thermal, and Solar Air Thermal are not yet supported.
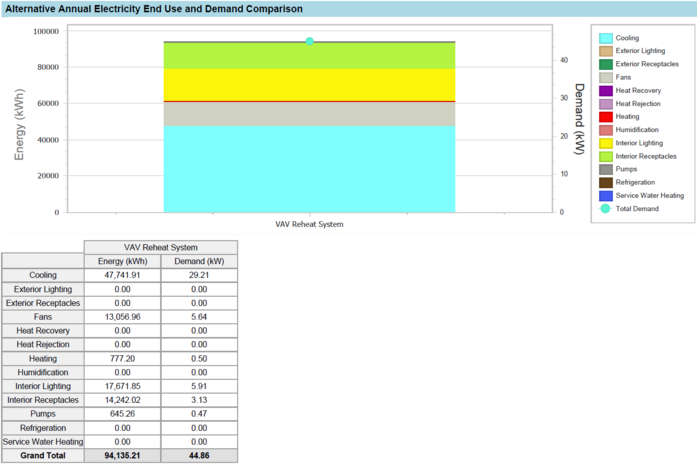
Alternative Annual Electricity End Use and Demand Comparison
This shows a graph and table of the electric consumption by category and demand for the building for each alternative. See the Site Consumption Summary.
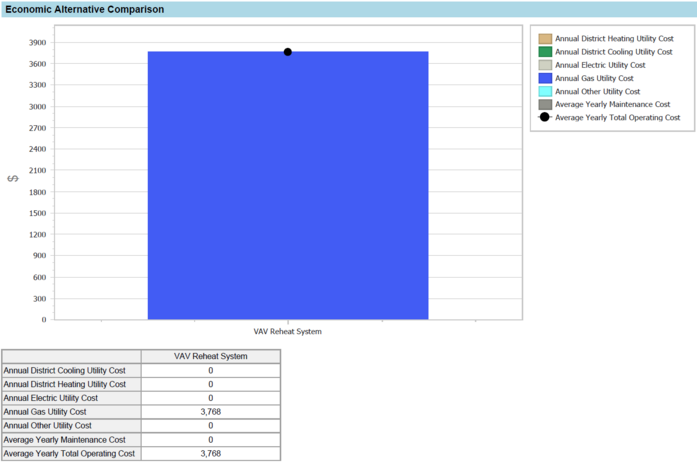
Economic Alternative Comparison
This shows a graph and table of the district cooling and heating, electricity, gas, and all other utilities grouped in the other category. Additional maintenance and operating costs can be entered on the Costs tab of the Economics section. See the Economic and Life Cycle Cost Summary for detail.