Calculate Results
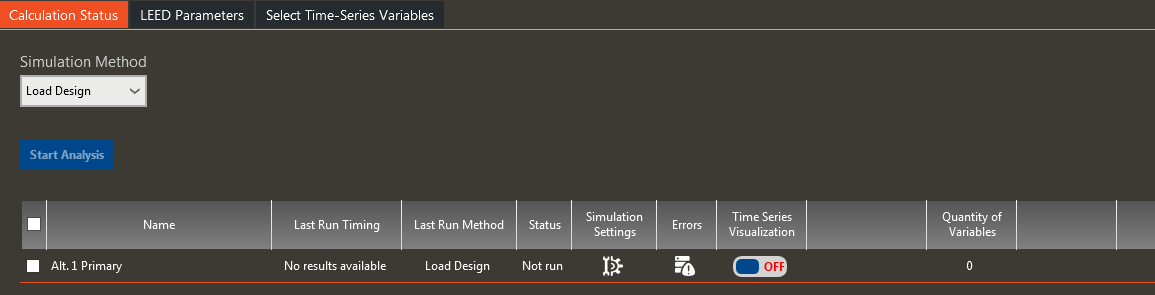
In the calculate results section, select the simulation method, which alternatives to run, the simulation settings, and the time-series output variables to save with the simulation. If the simulation has already been run, the screen will display the time stamp of the previous simulation, the methodology used during that simulation, the runtime, and information about the existence of output variables. The time-series visualization option is only available if the simulation method is set to Energy & Economics.
 
 
Simulation Method
Simulation Method controls the Simulation method which determines how the alternatives in the project will be calculated. There are two Simulation Methods
·         Load Design: Will calculate only the Load and Design
·         Energy and Economic: Will calculate Load Design, Energy and Economics
 
The Simulation Method selection can be made in two different screens.
1.       New project screen
The project defaults display the default setting, but will allow changing the Simulation Methodology per project.
2.       Calculate results screen
When the user has an Energy and Economics license, the simulation Methodology might be chosen as Energy and Economics to run every alternative with that methodology or Per Alternative. Load Design licenses will only allow to run it as Load Design.
 
 
Calculation Status
The calculation status displays the name of the different alternatives and their names, the last time each was run, the methodology used during that simulation, the status, whether the calculation passed or failed, any possible errors why it would have failed and information about the existence of output variables. The time-series visualization option is only available if the simulation method is set to Energy & Economics.
 
 
LEED Parameters
PRM Baseline Alternative
Construction Type
Auto-rotate building for ASHRAE 90.1
Version / Standard
Windows
 
Building Type
Skylights
 
Percent New construction
Doors
 
Percent Existing Renovation
 
 
ASHRAE Lighting Compliance
 
 
Climate Zone
 
 
Quantity of Floors


More information coming soon.
 
 
Select Time-Series Variables
 
The time-series output variable selection and the visualizer tool provides you the ability to output and view time series data used for analyzing the energy model results. In order to use the visualizer tool, you will first need to select time-series variables in the Calculate Results screen. After running an alternative with time-series output variables, the visualizer tool can be used for viewing Daily, Hourly, Monthly, Run Period, or Timestep outputs as plot charts. The data can also be viewed using the table option, column chart, line chart, surface chart, area chart, and range chart.
On the Select Time-Series Variables screen, select the set of output variables and output time frequency to be saved with the simulation. Using the preconfigured variable set, select a set of input variables for viewing in the visualizer. The output variables for visualizer selection can also be customized. The variables selected in the select time-series variables screen are applied to all the alternatives in the project if the simulation is run with the visualizer enabled.
 
Pre-configured Variable Set
Default: None
 
The pre-configured variable set selection provides a quick selection of output variable sets for viewing in the visualizer. The output variables contained in each pre-configured variable set are shown in the “Output Variables for Visualizer” box.
 
Alternatively, a custom variable set can be created by selecting variables in the “Available Output Variables” list.  When creating a custom set of variables, add variables to the “Output Variables for Visualizer” then select the “Save Custom” button.
 
When selecting a pre-configured variable set, it is important to note that these output variables will be saved for all alternatives that have the visualizer enabled.


Time Frequency
Default: Hourly
Choose the frequency of time-series data that is saved for viewing in the visualizer tool. The options are Daily, Hourly, Monthly, Run Period, or Timestep.  “Timestep” will report one datapoint per timestep. “Hourly” will aggregate the value for the hour. “Daily” will aggregate for the day (i.e. one value per day). “Monthly” will aggregate for the month (i.e. one value per month). “Run Period” will aggregate the output for the range of the visualizer run.
 
Available Outputs
The available outputs are grouped into five categories: building, meters, plants, site/weather, and systems variables. Below are additional details for each category of output variables:
       Building variables include variables for zone loads for envelope and internal loads, plenum and zone state points, airflow values, and zone heat balance information.
       Meter variables include meter outputs for coil, diesel, electricity, fuel oil, gasoline, natural gas, other fuels, other meters, and propane.
       Plant variables include variables for heat pumps, condenser, cooling plant, heating plant, VRF, water heater, and water to water heat pump.
       Site/weather variables include outdoor conditions, electricity purchased or produced, exterior consumption, and on-site generation variables
       System variables include variables for coils, evaporative cooler information, fan equipment details, terminal status, system and zone energy recovery data, and system level airflows.
 
Check All
The “Check All” button allows all the available outputs to be selected from the outputs for visualizer list.
 
Uncheck All
The “Uncheck All” button allows all the outputs to be cleared from the outputs for visualizer list.
 
 
Output Variables for Visualizer
This list includes all the variables selected for the visualizer tool. The variables selected in the select time-series variables screen are applied to all the alternatives in the project if the simulation is run with the visualizer outputs enabled. The toggle for enabling output variables for the visualizer for each alternative is shown on the Calculate Results screen.
 
Input Considerations:
Simulation time and the size of the Results file are directly related to the number of Output Variables that are included in the selection of the time-series variables. This is the main reason why all of the available output variables and meters that are available in the application should not be selected. It is important to be selective as to which output variables need to be investigated in the Visualizer before selecting the output variables. While in the visualizer, if results for an output variable that is not available for selection are needed, then that Output Variable will need to be added and the simulation rerun.