Sensitivity
Sensitivity is currently within our Candidate Feature Program. Candidate Features provide you with the ability to utilize new features months before they would be released, normally. Trane will learn from your real-world usage of these features and ensure they are properly designed to support your needs.
What is a Sensitivity Analysis?
A sensitivity analysis determines how different values of an independent variable (i.e. window u-value, building rotation, internal loads) affect a particular dependent variable (energy consumption, utility cost, etc.) under a given set of assumptions. In other words, sensitivity analyses study how various sources of uncertainty in a building model contributes to the model's overall variation. This technique is used within specific boundaries that depend on one or more input variables. It can allow the user to identify what inputs within the model's output is most sensitive. This can allow the modeler the ability to quickly identify what can be altered to have the largest effect.
How to perform a Sensitivity analysis
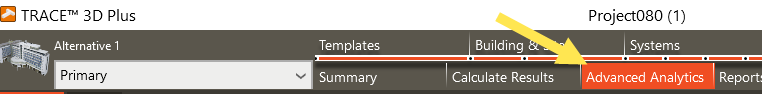
1. Select the Advanced Analytics tab from the menu ribbon at the top of the screen in TRACE 3D Plus.
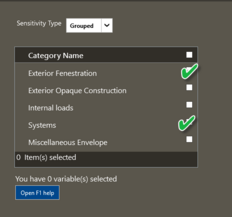
2. Select Grouped or Detailed parameter view.
3. Select the parameter category in which you would like analyzed (Note: The values must be selected for each alternative. To shift between alternatives select the alternative drop down in the top left area of the application).
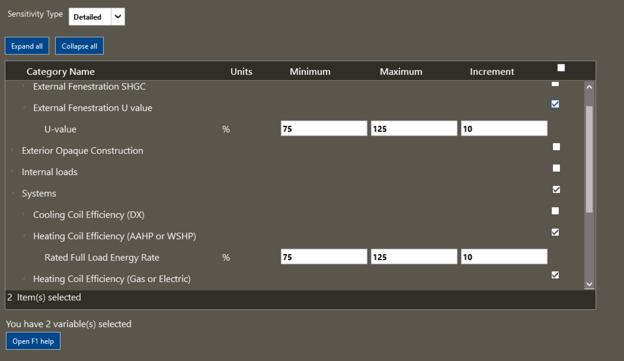
4. If Detailed is selected additional details are available
a. Select the entire category or subcategories of the parameters you would like analyzed.
b. Expand subcategories and the default values can be used or they can be altered.
c. The min, max, and the increment can be used.
i. The minimum value is the starting point for the analysis.
ii. The maximum value is the most that can be utilized but may not be the final value depending upon whether the increment is evenly divided
iii. The increment is the step that will be taken to perform the analysis
5. Return to the Calculate results screen.

6. Obtain your estimated Token count to run the analysis by hitting the Refresh button in Tokens to run.
7. Obtain your company’s Token balance by clicking on Get Available Tokens.

8. The simulation will not run if there is an insufficient balance. To obtain more tokens select Purchase tokens.
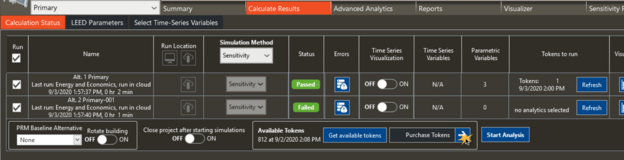
9. Check the Run box and change the Simulation Method to Sensitivity for any needed alternatives.
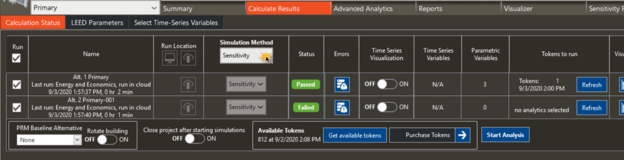
10. Begin the calculation by clicking the Start analysis button.

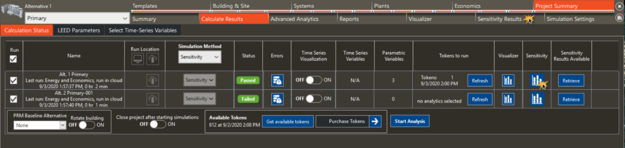
11. Upon completion hit the Sensitivity button or the Sensitivity Results tab.
How to analyze the Sensitivity Results:
|
In our application, you will be able to take your modeled building and analyze what causes the maximum variation. You can analyze specific inputs grouped into Exterior Fenestration, Exterior Opaque construction, Interior Loads, Systems, and Miscellaneous Envelope. By utilizing the “Grouped” sensitivity run type you will be selecting all parameters in that group and using default range and increment values for ease of use. By using the “Detailed” sensitivity type you can select specific variables. You can then select the minimum (starting) point for the analysis to begin. The maximum value is the upper bound of testing range by the analysis although it may not be the last point tested based on your increment. The increment is the step that each analysis will increase.
|
|
Example #1
Minimum is 75%
Maximum is 125%
Increment is 10%
The following points will be tested: 75%, 85%, 95%, 105%, 115%, and 125%
|
|
Example #2
Minimum is 75%
Maximum is 125%
Increment is 15%
The following points will be tested: 75%, 90%, 105%, and 120%
|
|
The range and frequency of the tested values can impact the results.
The output will be tested by making combinations of the input parameters and finding the resulting values. The selected parameters, range of the parameters, and the increment analyzed are set by the user but the combinations of each input value (in combination with other input values) are randomly assigned by the application. Once established, the combinations will remain the same. Each of these output values are in categories (similar to the input groupings). Once the category is selected then choose the item that you want to understand what the influence is relative to.
|
|
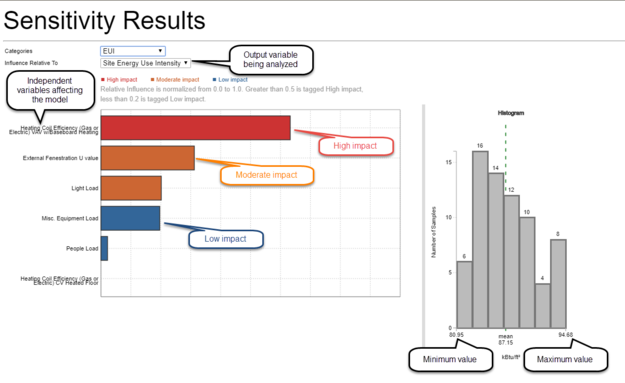
When analyzing the sensitivity results the resultants are normalized to a range of 0-1. This analyzes how much the variable is altered by varying combinations of the input parameters. If there is little influence (low impact) on the model then the normalized value will be less than 0.2. If there is a large influence (high impact) that a parameter places on the resultant then it will have a relative value greater than 0.5. Moderate impact items will be between the high and low. Each of these different levels will be color coded in the chart. By increasing the number of variables the overall impact will be diluted. Parameters, which have a high impact when only a few others are selected, would, likely, have the impact reduced when many parameters are selected. When transferring between dependent variables, which are highly correlated, you may not see a change in this graph.
There is also a histogram, which shows how the resultants are distributed. The minimum value, maximum value, and mean value calculated is displayed. Each bin of the histogram displays how many simulations fell into it. By utilizing the value that your original model obtained, the independent variables that affect the model can help the user understand what is the most useful for alteration. It will also help to understand the likely range that the dependent variable will land.
|