Site Load Profile
Site Load Profile
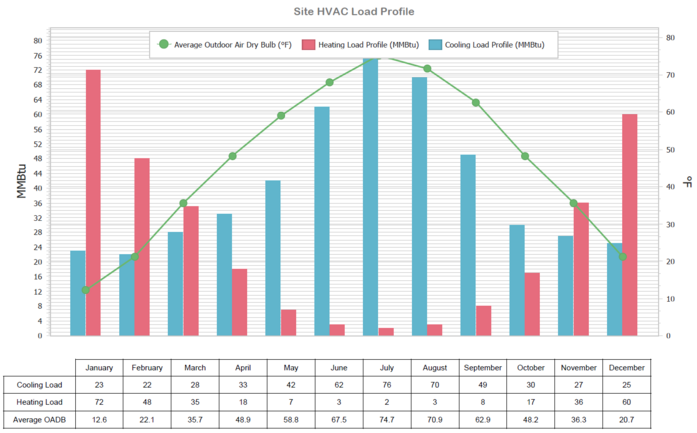
The Site Load Profile offers a monthly view for both the heating and cooling loads on the project. The green line is the average outdoor dry bulb. The blue bars represent the cumulative cooling load and the red bars the cumulative heating load. In the example below, the cumulative site cooling load in June was 62,000,000 btu and the site cumulative heating load in January was 72,000,000 btu. MMBtu means million btu (Latin MM means thousand-thousands).
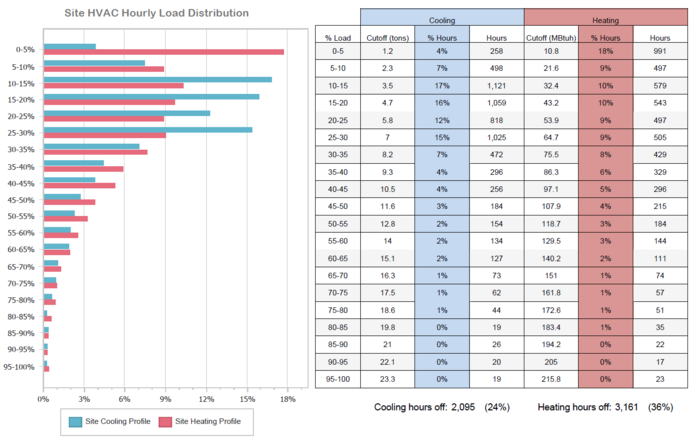
Site HVAC Hourly Load Distribution
The Site HVAC Hourly Load Distribution offers the data on an hourly basis using 5% intervals of the percent of the design loads for both heating and cooling. In the example below, the sum of all cooling hours above 50 percent is 678 hours, equal to 7.7 % of the 8760 hours in a year. This graph helps the user understand the statistics of the site loads. The graph below might cause the user to use caution in sizing HVAC equipment and how to optimize for part load conditions.