Economic and Life Cycle Costs Summary
Economic and Life Cycle Costs Summary
The economic and Life Cycle Cost Summary contains several sections listed below.
Life Cycle and Costing Parameters table
This table summarizes the economic parameters from the Life Cycle Parameters tab under the Economics tab. The Nominal Discount Rate and Inflation Rate will report as N/A when the Inflation Approach is set to Constant Dollar. The Real Discount Rate will report as N/A when the Inflation Approach is set to Current Dollar. The Building Area is calculated from the interior area of the entire building. The Net Conditioned Building Area is calculated from the interior area of all rooms assigned to zones not including rooms assigned as Unconditioned. The Initial Capital Investment Cost is input on the first line of the Investment Costs table on the Cost tab of the Economics section.
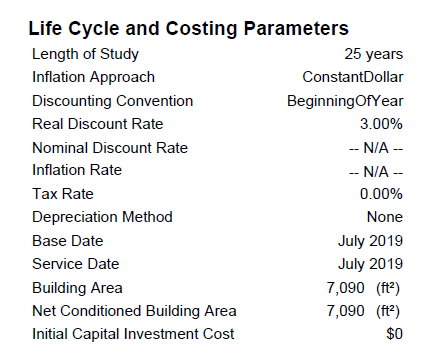
The parameter names can be identified by name from the Life Cycle Parameters tab.
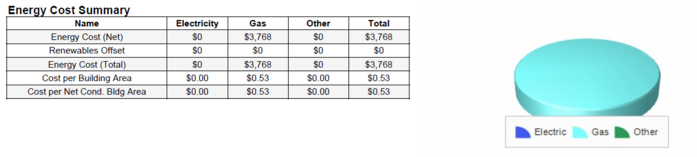
Energy Cost Summary table
This table shows the total dollar amount paid to each utility subdivided into Electricity, Gas, and all other utilities summed in the Other column. If any renewables are defined on the Create Site tab of the Building & Site section (photovoltaic array, wind turbine, internal combustion engine, or combustion turbine) these credits are shown in the Renewables Offset row. In order for the program to calculate the renewables offset, a sell rate must be defined in the Utility Rate library.
The Energy Cost (Total) is the difference between the Energy Cost (Net) and the Renewables Offset. The Cost per Building Area takes the Energy Cost (Total) divided by the Building Area reported in the Life Cycle and Costing Parameters table. The Cost per Net Cond. Bldg Area is the Energy Cost (Total) divided by the Net Conditioned Building Area reported in the Life Cycle and Costing Parameters table.
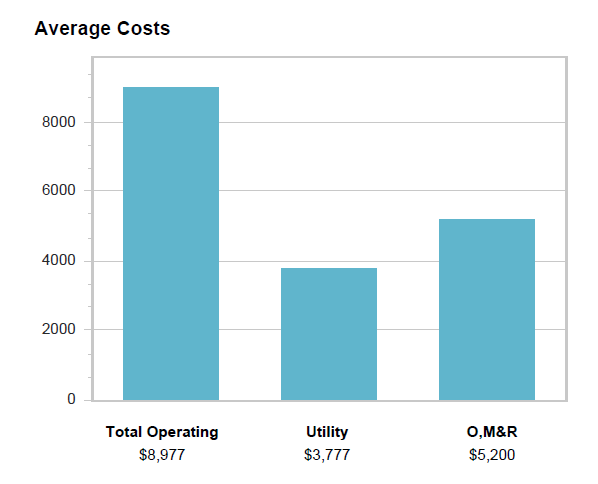
Average Costs
This section shows the average annual costs over the Length of Study. The Total Operating cost is the sum of the Utility cost and the O ,M&R cost. The Utility cost is the average utility cost over the Length of Study which should match the Energy Cost (Total) in the Energy Cost Summary table. The O, M&R is the average operation, maintenance and repair costs entered on the Costs tab of the Economics section over the Length of Study.
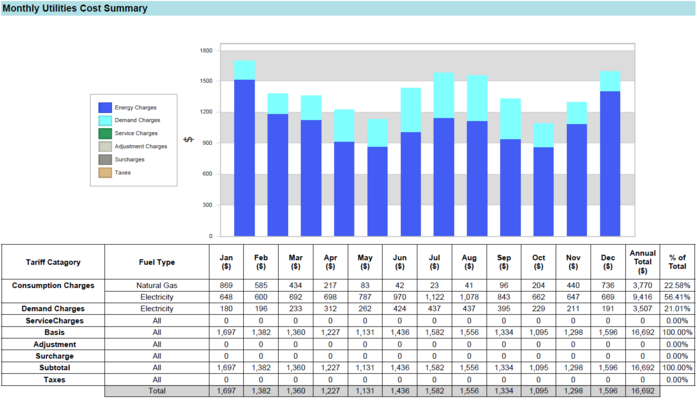
Monthly Utilities Cost Summary
The Monthly Utilities Cost Summary provides an overview of the overall utility costs and how each component of the rate structure affects the overall cost. Each fuel type is broken out separately for the consumption, demand, and service charges. Information for each of these is entered in the utility rate library. The basis is a sub total of the consumption, demand, and service charges. The cost Adjustment is entered in the utility rate library for each fuel type. Surcharge is not yet supported. The subtotal is the total of the Basis, Adjustment, and Surcharge. Taxes are entered in the utility rate library and include General Rate Taxes as well as individual Utility Taxes. The Total is the sum of the Subtotal and Taxes.
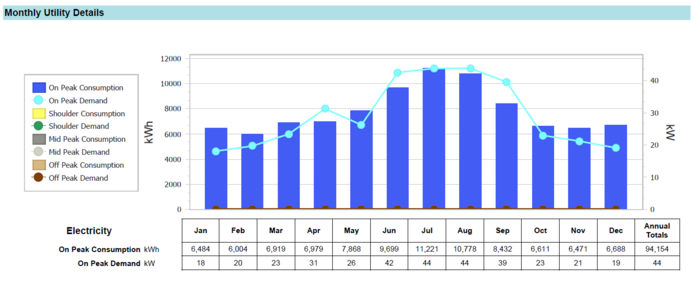
Monthly Utility Details
The Monthly Utility Details section provides a breakdown of the energy consumption and demand (if applicable) for each fuel type utilized by the project site. In the example below, in July, 11,221 kWh of site electrical energy was consumed, with a peak demand of 44 kW.
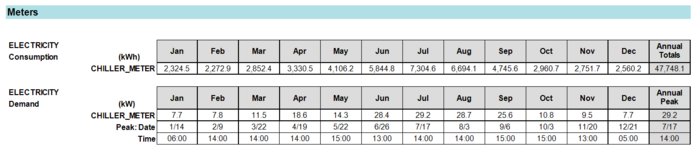
Meters
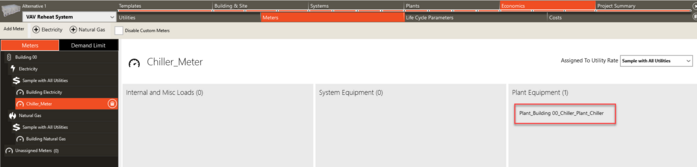
The Meters section appears if customer meters are applied on the Meters tab of the Economics section. The tables in this section of the report show each fuel type for each custom meter consumption and demand. The demand values also give the peak demand day and time for each month. If the “Disable Custom Meters” box on the Meters tab is checked, meters will not report here.
In the example below, a customer meter named “Chiller_Meter” was created on the Meters tab. The Chiller_Meter in this example was created to measure the electrical use of the chiller, as shown in the screenshot below. In July, the chiller used 7304.6 kWh with a peak demand of 29.2 kW on July 17 at 14:00 (2:00 pm).
Tariff Details
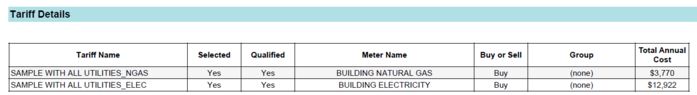
The Tariff Name gives the name of the Utility Rate library member used in this project. The Meter Name Displays the meter assigned to that’s row’s utility. The Buy or Sell column is populated with the input from the Buy or Sell Metering input in the Utility Rate library. The Selected, Qualified, and Group columns are not currently supported so Selected and Qualified will always report “Yes” and Group will always report “(none)”.
In the example below, there was $3,770 in natural gas costs and $12,922 in electrical costs.
Life Cycle Operating Cash Flow (without escalation)
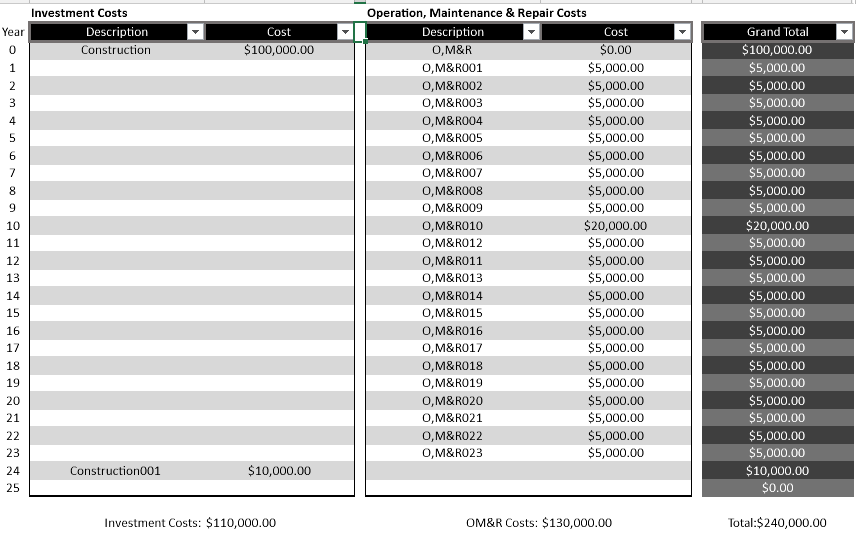
The Life Cycle Operating Cash Flow (without escalation) section provides a detailed cash flow diagram. Energy and Water costs are calculated based on the consumption of these utilities and the rates defined in the Utility Rate library. The Maintenance and Investment costs are input on the Costs tab of the Economics section.
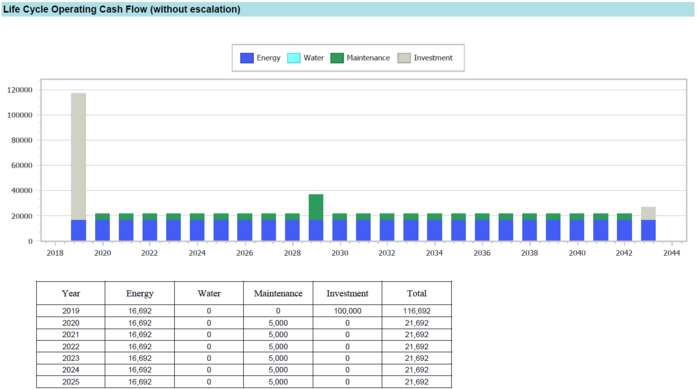
The annual investment and O&M costs were pulled from the Cost tab in the Economics section.
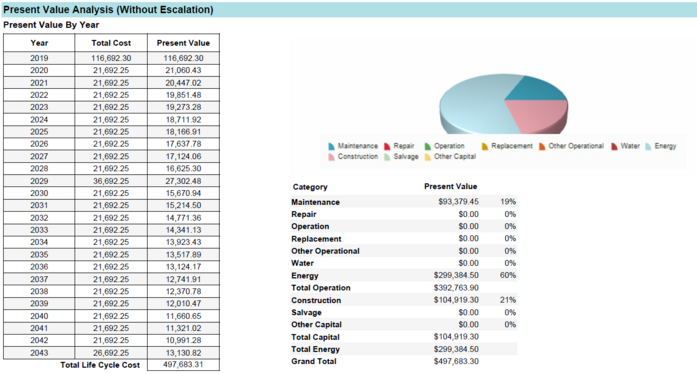
Present Value Analysis (without escalation)
The Present Value Analysis section simply displays the results of a present value analysis calculation. The Present Value is calculated using the Real Discount Rate (if using the Constant Dollar Inflation Approach) or the Nominal Discount Rate (if using the Current Dollar Inflation Approach) defined on the Life Cycle Parameters tab of the Economics section. If Current Dollar is used, the Total Cost will show inflation at the Inflation Rate defined on the Life Cycle Parameters tab.
In the example below, the life cycle cost is $497,683. $93,379 (19 %) is maintenance, $299,384 (60 %)is energy, and $104,919 (21 %) is construction.