Setpoint Not Met
Setpoint Not Met Summary
The Setpoint Not Met Summary shows the monthly occupied and unoccupied unmet hours for each zone. The report is divided into three sections: Total, Cooling, and Heating. The user may use this report to determine sources of unmet hours. An unmet interval is marked when the zone temperature is greater than 0.2 degrees C below the heating setpoint or 0.2 degrees C above the cooling setpoint.
The Temperature Profile Report provided additional assistance in unmet hours.
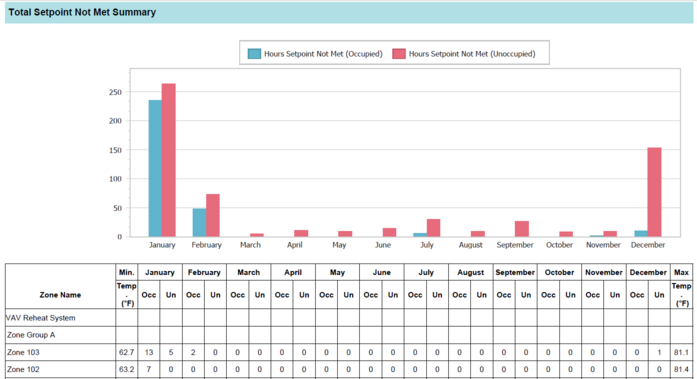
Total Setpoint Not Met Summary
This report shows all unmet hours, not distinguishing unmet cooling hours from unmet heating hours. In the example below, January has 235 unmet occupied hours and 264 unmet unoccupied hours. 13 of the unmet occupied hours and 5 of the unmet unoccupied hours were caused by Zone 103. The user can learn from this information whether occupied or unoccupied hours are problematic. However, this does not inform the user on whether cooling or heating hours are problematic. The user should examine the cooling and heating sections separately for more direction.


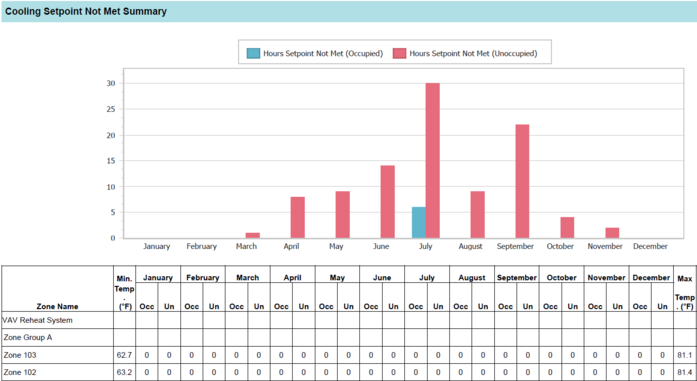
Cooling Setpoint Not Met Summary
This report shows unmet cooling hours. In the example below, July has 6 unmet occupied cooling hours and 30 unmet unoccupied cooling hours. Zone 103 from above did not contribute any unmet cooling hours. In the example below, unoccupied hours have more unmet interval than occupied hours. The number of unmet hours is highest in July. Such information can be used to determine the source of unmet hours. Comparing this information to the total setpoint not met summary, the user can conclude that 100 percent of unmet hours in the building in July were in cooling mode.


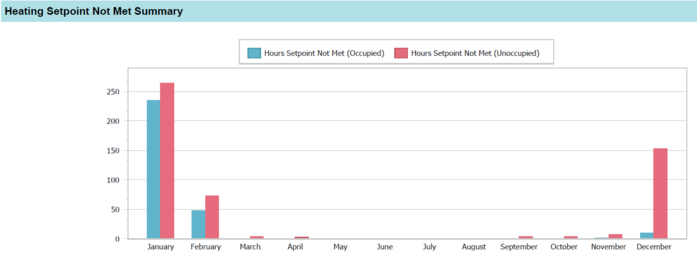
Heating Setpoint Not Met Summary
This report shows unmet heating hours. In the example below, In the example below, January has 235 unmet occupied heating hours and 264 unmet unoccupied heating hours. 13 of the unmet occupied heating hours and 5 of the unmet unoccupied heating hours were caused by Zone 103. In the example below, unoccupied hours have more unmet interval than occupied hours. The number of unmet hours is highest in January. Such information can be used to determine the source of unmet hours. Comparing this information to the total setpoint not met summary, the user can conclude that 100 percent of unmet hours in the building in January were in heating mode.

