Zone Summary
Zone Summary
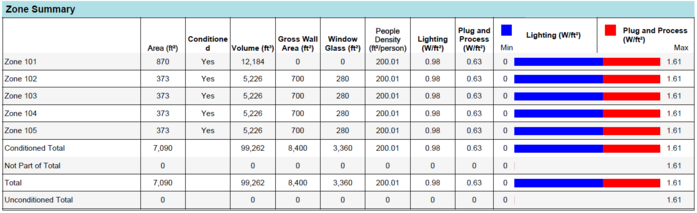
The Zone Summary table provides various high-level values for each zone: floor area, zone volume, wall area, glass area, people density, lighting density, and plug load density. The bar graph on the right provides a means to quickly compare the lighting and plug load intensity between zones. This bar graph could help the user quickly determine if a specific zone has internal loads that seem too high or too low compared to other zones. The minimum value is always zero. The maximum value is relative to the building, using the maximum value of all zones. If the maximum value changes, so will the appearance of the graphs.
The Design Day table shows the cooling and heating design conditions for each zone. The bar graph on the right provides a means to quickly compare heating and cooling loads between zones. This bar graph could help the user quickly determine if specific zones are contributing too much or too little load to the building. The minimum value is always zero. The maximum value is relative to the building, using the maximum value of all zones. If the maximum value changes, so will the appearance of the graphs.