Weather Selection
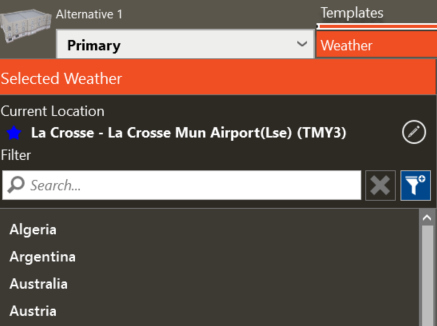
The Weather Selection allows navigation to specific world locations. Although the weather location can be selected in the New Project screen, you can see other locations and choose a different location for each alternative. Available locations include the standard library members as well as custom libraries that have been copied and modified or imported by you into the library. This screen displays a tree at the left with the Selected Weather, a Filter and a list of all the countries in alphabetical order that have weather files. Navigation to available locations can also be done using the map on the right.
Pins on the map represent existing locations in the library. Green Pins are standard EPW locations. These locations are included with the program installation and can’t be modified. Purple pins are custom locations that have been copied or imported by you and can be modified; these locations can be various types of files. Refer to the Import help to see the supported formats.
A typical meteorological year (TMY) data set provides designers and other users with a reasonably sized annual data set that holds hourly meteorological values that typify conditions at a specific location over a longer period, such as 30 years. TMY data sets are widely used by building designers and others for modeling renewable energy conversion systems. Although not designed to provide meteorological extremes, TMY data have natural diurnal and seasonal variations and represent a year of typical climatic conditions for a location. The TMY should not be used to predict weather for a particular period, nor is it an appropriate basis for evaluating real-time energy production or efficiencies for building design applications or solar conversion systems.
The TMY data set is composed of 12 typical meteorological months (January through December) that are concatenated without modification to form a single year with a serially complete data record for primary measurements. These monthly data sets contain actual time-series meteorological measurements and modeled solar values, although some hourly records may contain filled or interpolated data for periods when original observations are missing from the data archive.
At sites where data are available for 30 years, the base time period for the TMY algorithm spans 1976-2005. For the remaining sites, the base time period spans 1991-2005. For example, the Buffalo International Airport location uses 1980 data for January 1988 data for February, and 1995 data for May. While the Sacramento location uses 1988, 1976, and 2002 respectively.
See this reference for complete background on the TMY3 weather files: https://doe2.com/Download/Weather/TMY3/Users_Manual_for_TMY3_Data_Sets.pdf
Selected Weather
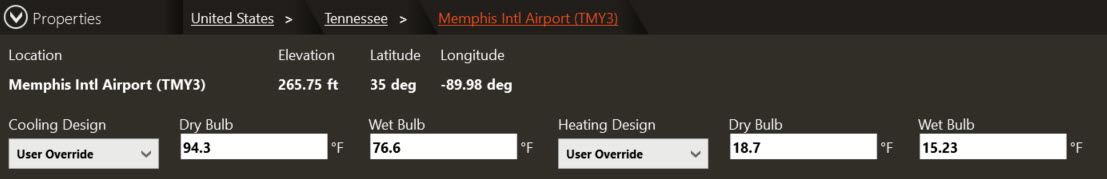
The selected weather is shown on the top left of the screen. This is the weather file that will be used to calculate Load Design and Energy calculations for the active alternative. Clicking on the View/Edit Properties button will allow the user to view basic information on the weather location and adjust the Cooling Design and Heating Design conditions. Note that these conditions represent the max/min values for the design day profiles. Load calculations will be performed for each hour of the design days as outlined in the Load Design Methodology.
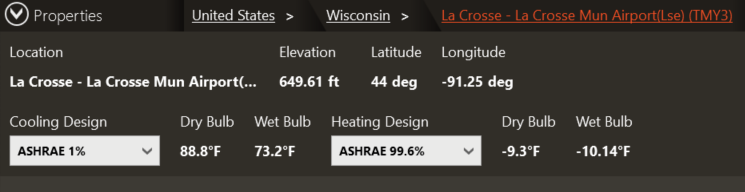
The design conditions can be selected based on the ASHRAE weather data. For example, selecting a Cooling Design of ASHRAE 1% means that 1% of hours throughout the year will exceed this temperature. A Heating Design of 99.6% means that 99.6% of hours throughout the year will exceed this temperature. The User Override can be selected from the dropdown to enter custom design weather conditions, including wet bulb and dry bulb.
Detailed weather properties can be accessed in the Weather Library by clicking on Go to Library in the upper right corner of the program.
Filter
The left tree has a search filter where you can enter the name of the city or location and the program will filter the locations that start with that name.
Country List
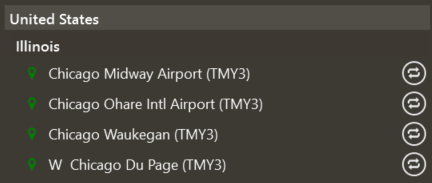
You can select a country from the list to see all the available locations for that subregion. A “Replace Weather Location” button is located to the right of the name of each location. This is used to change the location for the alternative. If the location is clicked, but not selected to replace the current location, the map will zoom in to show the location. The properties menu is displayed at the bottom.
You can select a country from the list to see all the available locations for that subregion.
-
Single left click on the Country will either provide a list of actual locations or a further subdivision by State or Province.
-
Individual locations can be identified by the circular “Replace Weather Location” button on the right. Subdivisions will not have this button but can be opened to see their list of locations.
-
Single left click on any location will open a quick preview of the weather data along with the circular “Replace Weather Location” button.
A “Replace Weather Location” button is located to the right of the name of each location. This is used to change the location for the alternative. If the location is clicked, but not selected to replace the current location, the map will zoom in to show the location and the data preview will appear over the map. The “Replace Weather Location” button is visible in this preview to the right of the data. The Design Conditions will only be editable after the “Replace Weather Button” is clicked.
The properties menu is displayed here showing the Country Name, Subdivision, and the list of locations with the “Replace Weather Location” button on the right.
Map
The right side of the screen is an interactive map, it allows you to navigate through the world to select from available locations. Zooming and panning functions are available through the map control on the screen or with the mouse (scroll to zoom and click and drag to move).
-
Right click on the mouse and hold the button down to move the image
-
Scroll in to zoom in
-
Scroll out to zoom out
-
Using the Keyboard, Press and hold the following keys:
-
Shift and W to move down the image
-
Shift and S to move the image upwards
-
Shift and A to move the image to the right
-
Shift and D to move the image to the left
When the map is zoomed out at a Region level, for example per country or state, a blue circle appears in the map instead of the pins to display a list of the multiple locations that can be found on that particular area. You can select one location to review the properties. When you click on a map pin, the properties menu is displayed at the bottom with design information for that specific location. To select a location for the simulation, the “Replace Weather Location” button needs to be pressed.
Pins on the map represent existing locations in the library. A key with definitions for each pin color is located in the lower right corner. Definitions will appear when the cursor hovers over the key. The star is the current Selected Weather location for the active alternative. Green Pins are standard EPW (EnergyPlus Weather) locations. These locations are included with the program installation and cannot be modified. Purple pins are custom locations that have been copied or imported into the Library by the user and can be modified; these locations can be various types of files. Refer to the Import help to see the supported formats. Yellow pins are Selected Weather locations used by other Alternatives in the project. The Weather Library can be accessed from the Go to Library button in the top right corner of the program.
Properties
The following information is contained in the properties menu for each location, unlisted information is available in the Weather Library:
Elevation
The elevation is the weather location’s height relative to sea level. Locations below sea level show as negative values.
|
Default: 0 ft / 0 m
|
|
Min & Max: -984 to 29199 ft / -300 to 8900 m
|
|
Typical Range: N/A
|
|
Units: ft / m
|
Latitude
This field represents the latitude (in degrees) of the facility. By convention, North Latitude is represented as positive; South Latitude as negative. Minutes are represented in decimal fractions of 60. (15’ is 15/60 or .25)
-
In the Northern hemisphere, the latitude ranges from 0 to 90 degrees.
-
In the Southern hemisphere, the latitude ranges from 0 to -90 degrees.
|
Default: 0°
|
|
Min & Max: -90 to 90°
|
|
Typical Range: N/A
|
|
Units: Degrees
|
Longitude
This field represents the longitude (in degrees) of the facility. By convention, East Longitude is represented as positive; West Longitude as negative. Minutes are represented in decimal fractions of 60. (15’ is 15/60 or .25)
|
Default: 0°
|
|
Min & Max:
|
|
Typical Range: N/A
|
|
Units: Degrees
|
Cooling Design
Cooling Design defaults to 1% for Dry bulb and Wet bulb. The percentage means that only 1% of the time during the year may the cooling values be exceeded. Other options are 0.04%, 2% and User Override. Values within each percentage can’t be modified, only the User Override option allows you to enter the desired value.
Dry Bulb
This field refers to the maximum dry-bulb temperature.
|
Default: From Weather Library (ASHRAE 1% Summer Design Condition)
|
|
Min & Max: -130 to 158°F / -90 to 70°C
|
|
Typical Range: 60 to 120°F / 15 to 48 °C
|
|
Units: °F / °C
|
Wet Bulb
This field refers to the mean coincident dew point temperature at maximum dry-bulb.
|
Default: From Weather Library (ASHRAE 1% Summer Design Condition)
|
|
Min & Max: -130 to 158°F / -90 to 70°C
|
|
Typical Range: 60 to 120°F / 15 to 48 °C
|
|
Units: °F / °C
|
Note: Design conditions default to values from ASHRAE HoF 2013 tables. If you want to use the design values from the 8760 weather file, this must be selected in the library. Select the Design Weather Source as "Design Weather based on custom weather file.”
Heating Design
Heating Design defaults to 99% for Dry Bulb and Wet Bulb. The percentage means that the heating values may be lower than the displayed design only 1% of the time during the year. Other options are 99.6% and User Override. Values within each percentage can’t be modified, only the User Override option allows you to enter the desired value.
Dry Bulb
This field refers to the maximum dry-bulb temperature.
|
Default: From Weather Library (ASHRAE 99% Winter Design Condition)
|
|
Min & Max: -130 to 158°F / -90 to 70°C
|
|
Typical Range: 60 to 120°F / 15 to 48 °C
|
|
Units: °F / °C
|
Wet Bulb
This field refers to the dew point temperature at mean coincident dry-bulb.
|
Default: Calculated from Weather Library Dew Point (ASHRAE 99% Humidification Design Condition)
|
|
Min & Max: -130 to 158°F / -90 to 70°C
|
|
Typical Range: 60 to 120°F / 15 to 48 °C
|
|
Units: °F / °C
|
Note: Design conditions default to values from ASHRAE HoF 2013 tables. If you want to use the design values from the 8760 weather file, this must be selected in the library. Select the Design Weather Source as "Design Weather based on custom weather file.”