Data Visualizer
Visualizer Tool
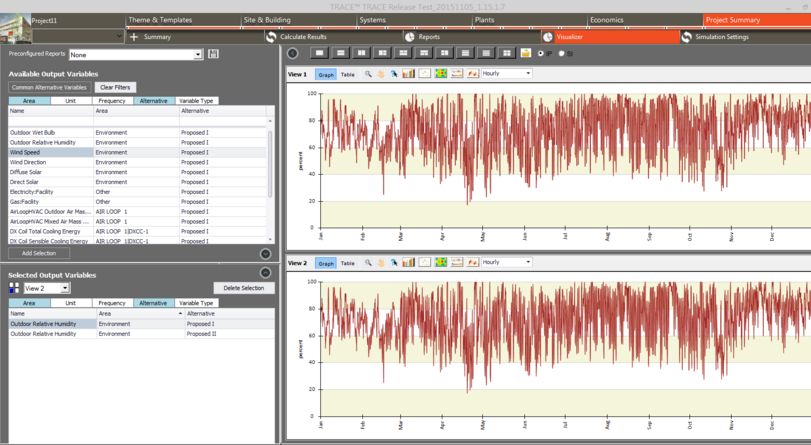
After running an alternative with time-series output variables, the visualizer can be used for viewing timestep, hourly, daily, monthly, and run period frequency outputs. In addition to viewing timestep or hourly plot charts, you can also view data using the table option, surface chart, bar chart, and box and whiskers tools. On the left side bar, select the outputs you would like to view. The view window displays the output data for the selected outputs. You can modify the view options within the tool by interacting with the icons in the view window.

Design Day Visualizer Presets
These presets allow for the viewing of the Load Design Days and their components over the course of the year to increase understanding of why a given day is selected as the Load Design Day.

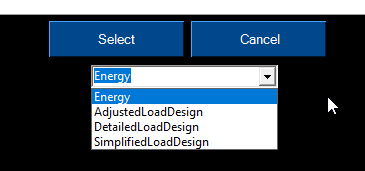
The options for this load design specific variable sets can be seen below along with the defult energy preset when opening up the visualizer.
-
Detailed Load Design (Room Load)
-
Simplified Load Design (Zone Load)
-
Adjusted Load Design
